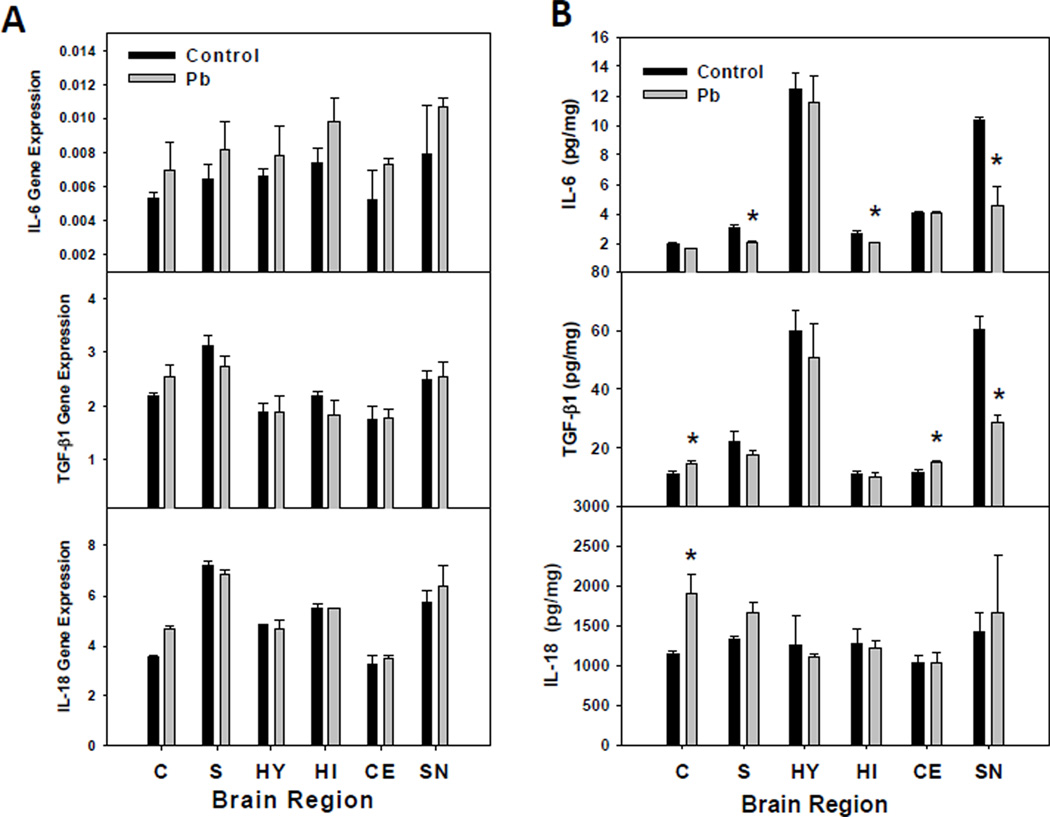
Figure 6.
Regional CNS cytokine expression after Pb exposure. (A) IL-6, TGF-β1, and IL-18 gene expression in different female brain regions were assayed by real-time TaqMan RT-PCR as described in the methods. Relative expression was calculated using the formula (2−(ExpCT-GAPDH CT) × 1000), where CT is the threshold cycle number. (B) Protein concentrations for IL-6, TGF-β1, and IL-18 were measured by ELISA (IL-18 and TGF-β1) or Luminex (IL-6). The protein data represent an N of 3 litters each for control and Pb treated female pups. The bars represent mean ±SD; the * indicates a P≤0.05.

