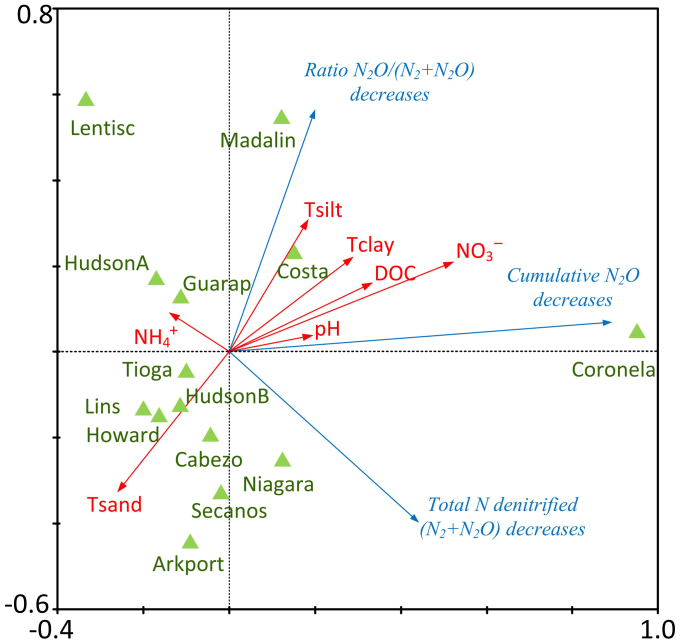
Figure 1. Correlation triplot based on a redundancy analysis (RDA) depicting the relationship between the main physico-chemical characteristics of the soils (predictor variables) and the differences induced by biochar applications (response in soil) (according to Lepš and Šmilauer49).
Blue arrows point to maximum shifts produced by the biochar amendment, i.e. a decrease in the total cumulative N2O, the N2O/(N2 + N2O) ratio, and the flux of total N denitrified (N2 + N2O). Eigenvalues of the first two axes are 0.343 and 0.161, the sum of all canonical axes is 0.555. “Cumulative N2O” represents the difference (control-biochar) in total N2O emitted during the entire incubation period; “ratio” and “Total N denitrified” represent the differences (control-biochar) at the day selected for isotopic gas analysis (see Fig. S1). Tsilt, Tclay and Tsand represent the percentages of soil silt, clay and sand. DOC: dissolved organic C in soil.

