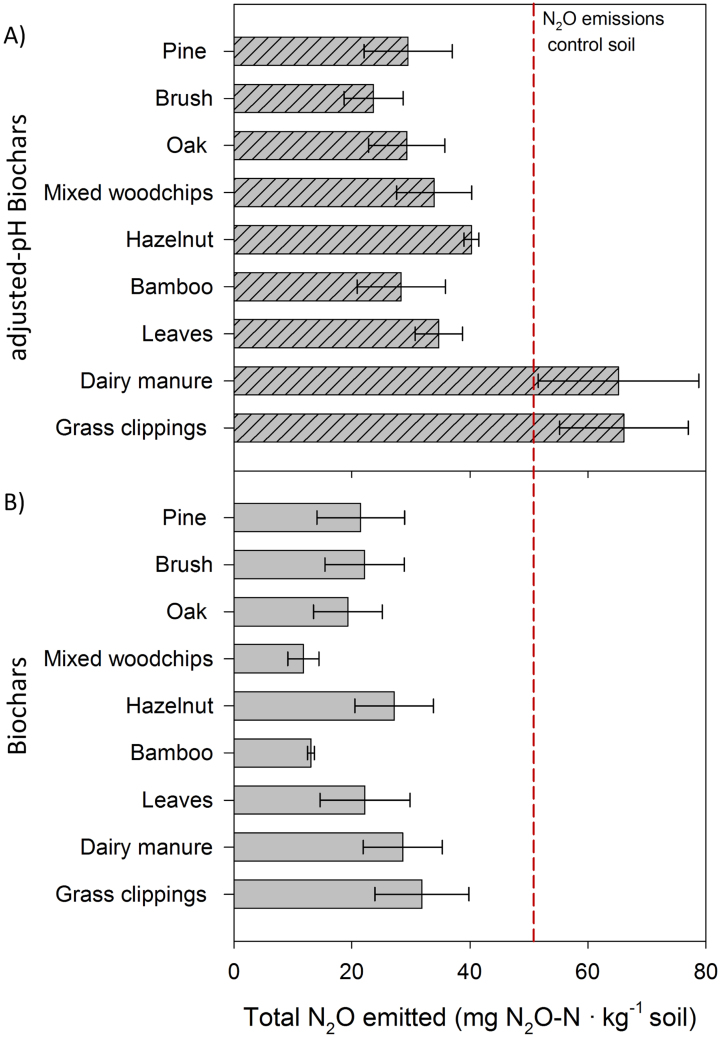
Figure 2. Total N2O emissions after 30 days of incubation of a muck soil (Elba) amended with different biochars (2% weight) under denitrification conditions (90% WFPS, 30°C).
The dashed line represents emissions from the control soil (unamended). Fig. 2A shows N2O emissions from soil amended with biochars for which the pH had been adjusted to the pH of the soil (5.6). Fig. 2.B shows N2O emissions from soil amended with biochars at their actual pH. Biochars are arranged from high to low C/N ratios. Error bars represent standard errors of the mean (n = 4).

