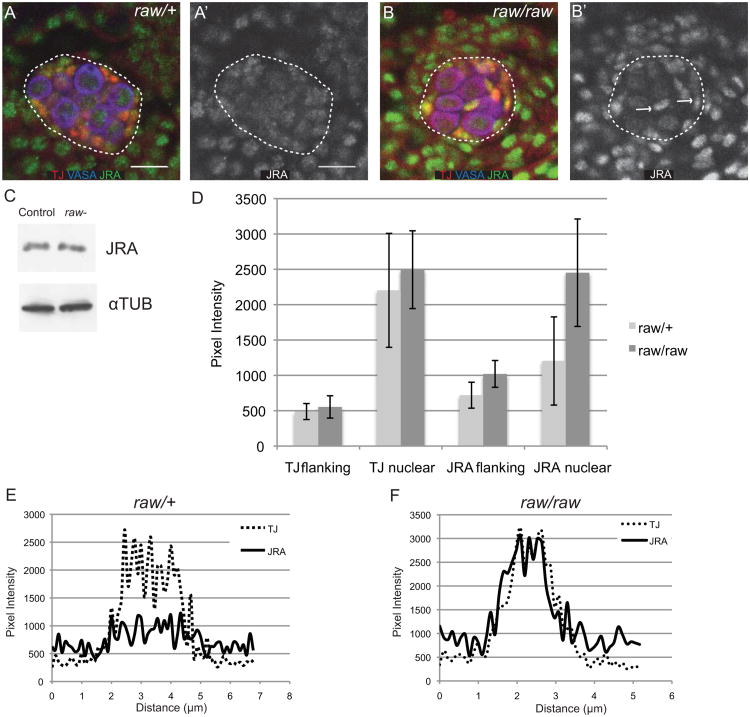
Figure 4. raw regulates JRA subcellular localization.
(A, B) Stage 15 embryos immunostained stained for JRA (green), TJ (red, SGPs), VASA (blue, germ cells). (A′, B′) JRA alone. (A, A′) raw heterozygous controls. (B, B′) raw134.47/raw155.27. The gonad has been outlined with a dashed line. Scale bar: 10 μm. Posterior is to the right. Arrows indicate SGPs with altered JRA expression. (C) Western blot to analyze JRA levels in raw134.47/raw155.27 mutant embryos relative to controls. Lane 1 is control embryos (+/+ or raw155.27/+ or raw134.47/+). Lane 2 is raw-(raw134.47/raw155.27embryos). (D) Quantitation of TJ and JRA immunofluorescence intensity within the nucleus and in flanking regions. See methods for details. (E, F) Representative plots of JRA and TJ immunofluoresence intensity in individual SGPs in raw heterozygous controls (E) or raw134.47/raw155.27 (F). Note that JRA is more uniform across the cell in controls (E) but co-localizes more closely with TJ (nucleus) in raw mutants (F).

