Figure 3.
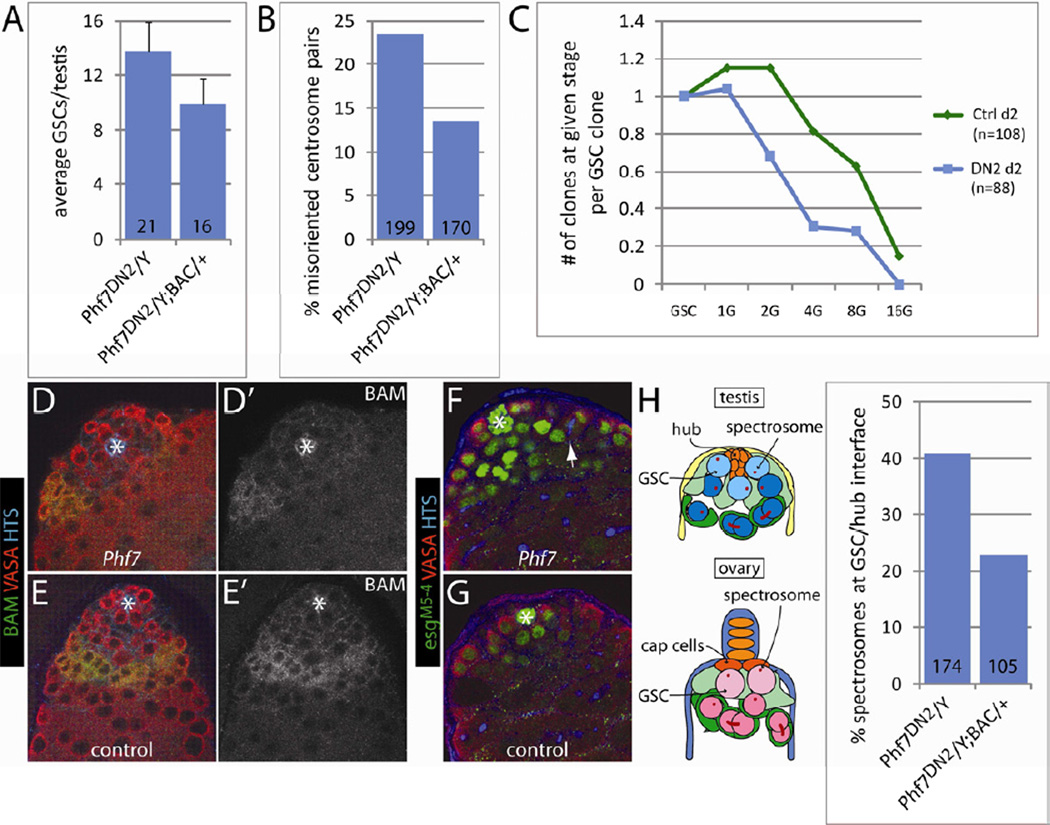
Profiles of GSCs and spermatogonia in hemizygous Phf7-mutant testes compared to controls. A) Average numbers of GSCs in mutant and BAC-rescued testes. Error bars represent standard deviations. B) Percentages of centrosome pairs in GSCs that did not exhibit hub-proximal orientation in mutant and BAC-rescued testes. C) FLP-mediated lineage analysis of GSCs and developing spermatogonia in hemizygous Phf7-mutant (blue squares) and control testes (green diamonds). Genotypes are as in Experimental Procedures. The number of spermatogonial clones at 1-, 2-, 4-, 8-, and 16-cell stage per GSC clone is plotted at 2 days post clonal induction. D–G) Adult testes are immunolabeled as indicated. D' and E' show the BAM staining alone. Hubs are marked with white asterisks. Note the reduced population of BAM-positive spermatogonial cysts in Phf7-mutant (D, Phf7ΔN2/Y) compared to BAC-rescued testes (E, Phf7ΔN2/Y; BAC/+). F, G) Expanded population of esgM5-4-expressing germline in Phf7-mutant (F, Phf7ΔN2/Y) testes compared to controls (G, Phf7ΔN2/Y; BAC/+). Arrow points to a branched fusome connecting a 4-cell spermatogonial cyst. H) Localization of spectrosomes is altered in Phf7-mutant GSCs compared to BAC-rescued counterparts. Cartoons on the left depict the typical spectrosome localization patterns that are different in male and female GSCs. The percentages of GSCs exhibiting hub-proximal spectrosomes are plotted on the graph to the right for both Phf7-mutants and BAC-rescued samples. For all bar graphs, the numbers at the base of the bars indicate the sample size for each genotype. See also Figure S3.

