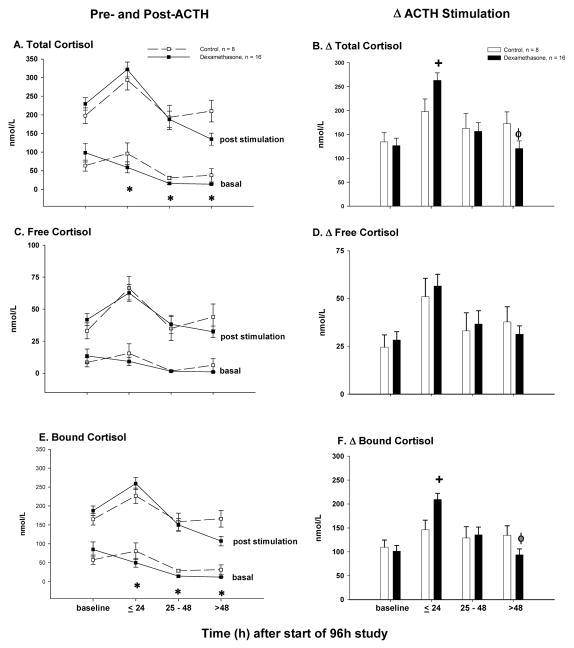
Figure 2.
For dexamethasone-treated animals (closed boxes connected by a solid line) and controls (open squares connected by a dashed line), the mean concentrations (nmol/L) ± SEM pre- and post-ACTH stimulation (results of low and high dose ACTH challenge combined) at serial time points are shown for total cortisol (panel A), free cortisol (panel C) and protein-bound cortisol (panel E). For dexamethasone-treated animals (closed bars) and controls (open bars), the mean ± SEM change from pre- to post-ACTH stimulation (i.e., delta cortisol; results of low and high dose cosyntropin challenge combined) is shown for total cortisol (panel B), free cortisol (panel D) and protein bound cortisol (panel F).

