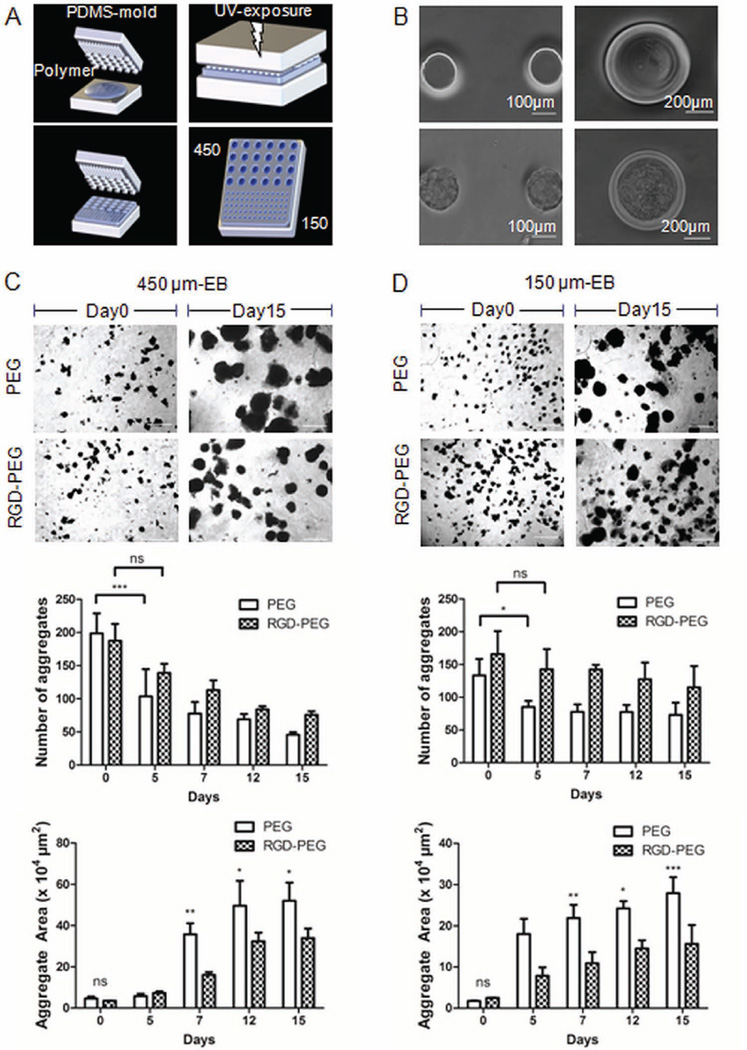
Figure 1.
Formation of Embryoid bodies (EBs) derived from murine ES cells. (A) Different sized microwell arrays (150 µm and 450 µm in diameter) were fabricated using poly(ethylene glycol) (PEG, 1 kDa) and polydimethylsiloxane (PDMS) molds under UV exposure. Phase contrast microscopy images (B) microwells with a diameter size of 150 µm (Left, scale bar: 100 µm) or 450 µm (Right, scale bar: 200 µm). Upper panel: microwells without cells, lower panel: cell-seeded microwells. (ES cell seeding density: 0.3 × 10⁶ cells/ 150 microwell chip, and 1.5 × 10⁶ cells/ 450 microwell chip). (C) Phase contrast microscopy of encapsulated 450 µm-EBs in 4-arm PEG (upper panel) and in RGD-PEG (lower panel) at days 0 and, day 15 (Scale bar: 1 mm). Decreased aggregation of encapsulated EBs in RGD-PEG polymer was observed compared to unmodified PEG polymer. Upper graph: Reduced number of encapsulated aggregates with significant difference at early time points of encapsulation. Lower graph: Increased area in µm2 per EB. Area measurements were performed with imageJ. The area of 20 EBs within one sample was measured to obtain a single value per EB and sample. Demonstrated results compare aggregation development in PEG and RGD-PEG. (D) Phase contrast microscopy of encapsulated EBs in PEG (upper panel) and RGD-PEG (lower panel) at days 0 and day 15 with initial diameter size of 150 µm (Scale bar: 1 mm). The decrease of the number of encapsulated EBs, along with the increase of the area per EB with initial size of 150 µm is more pronounced in PEG than in RGD-PEG. Mean area in µm2 per aggregate in PEG vs. RGD-PEG ± SD (n = 3, * indicates P ≤ 0.05 compared to RGD-PEG).

