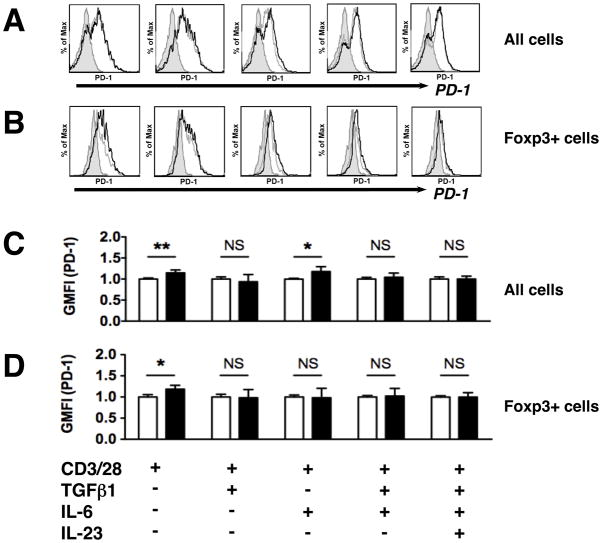
Figure 4. G-1 has a modest effect on PD-1 surface expression.
CD4+CD62LhiCD44lo naive T cells from Foxp3egfp mice were collected by FACS and cultured for 4 days under the conditions indicated, supplemented with either DMSO or 100nM G-1, as indicated. Surface expression of PD-1 was determined by flow cytometry. (A, B) Representative histograms showing gating for analysis of PD-1 surface expression, quantified using geographic mean fluorescence intensity (GMFI), on DMSO- (grey line) or G-1- (black lines) treated cells, and isotype (rat IgG2b,κ) controls (shaded region). (C, D) Summary of data from three to four independent experiments showing relative GMFI for G-1 treated cells (black bars) relative to DMSO treated cells (white bars). Treatment conditions for all panels (AD) are indicated at the bottom of the figure. P values were determined by Student’s t-test. *** = P < 0.0005, ** = P< 0.005, * = P < 0.05, N.S. = not significant. Error bars = S.D.

