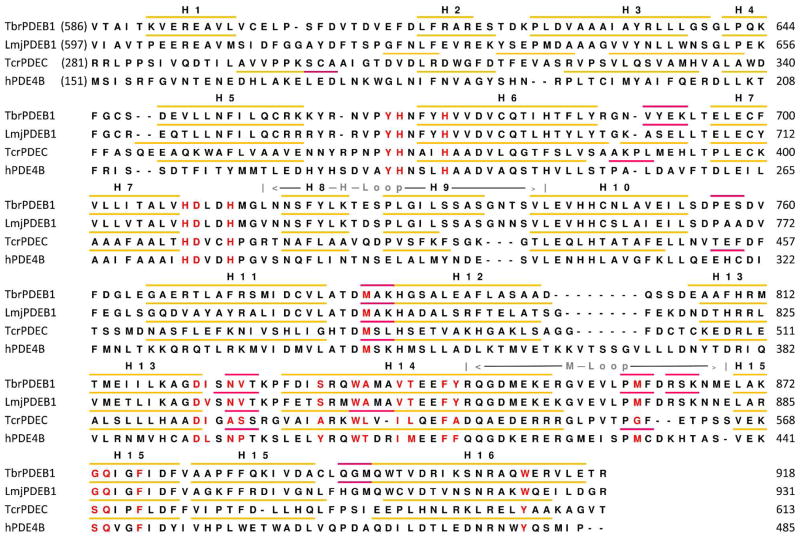
Figure 3.
Sequence alignment between TbrPDEB1, LmjPDEB1, TcrPDEC and hPDE4B. The bars indicate secondary structure features, α-helices are shown in yellow and 310-helices are shown in fuchsia. Residues of the substrate binding pocket are shown in red. The helix numbers of TbrPDEB1 are indicated above the sequence, as are the H-loop and the M-loop.

