
Table 2.
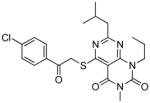
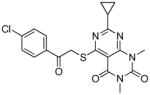
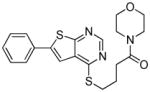
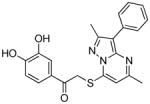
TbrPDEB1 inhibitors identified in the virtual screening.
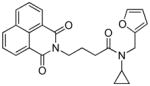
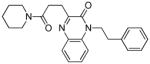
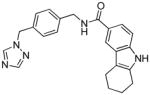
| cpd | Virtual screening hits | TbrPDEB1 IC50 in μMa | IFP1 (rank)c | IFP2 (rank)d | PLANTS (rank)e | ROCS (Closest scaffold)f | ECFP4 (Closest scaffold)g | hPDE4B IC50 in μMb |
|---|---|---|---|---|---|---|---|---|
| 16 |
|
10 | 0.80 | 0.63 | −102.8 | 1.11 (15) | 0.18 (6 - NEU222) | 26 |
| 17 |
|
0.79 (33) | 0.61 | −94.7 | 1.21 (15) | 0.18 (6) | ||
| 18 |
|
12 | 0.75 (44) | 0.70 | −93.8 | 1.07 (15) | 0.20 (2/4 - 8d) | 14 |
| 19 |
|
13 | 0.53 | 0.75 (13) | −101.3 | 1.02 (12) | 0.21 (5) | 5 |
| 20 |
|
41 | 0.65 | 0.75 (6) | −103.6 | 0.95 (15) | 0.16 (2/4 - 16b) | 16 |
| 21 |
|
54 | 0.75 (24) | 0.63 | −95.3 | 1.10 (6 - NEU227) | 0.24 (2/4 - 8d) | 15 |
| 22 |
|
75 | 0.45 | 0.55 | −109.1 (9) | 0.924 (2/4 - 13b) | 0.21 (6 - NEU432) | 68 |
The structures of the inhibitors are given with their IC50 concentrations for full-length TbrPDEB1 and hPDE4B. It should be noted that the virtual screening hits did not reach 100% inhibition at the highest concentrations measured. Curves were assumed to plateau at 100% inhibition and fitted according to a one site competitive binding model to derive IC50 values. The measured curves and their fits are provided in Figure S3 of the Supporting Information.
The IFP1, IFP2 and PLANTS scores of the docking poses used to select the compounds are shown, with the scores printed in bold according to whether the compound was selected using routes A, B or C respectively. The ranking in selection routes A–C is also given for the score used to select the compound.
ROCS and ECFP4 score structural similarity between compounds. A maximum similarity cutoff of 1.4/2 was set for ROCS and 0.4/1 for ECFP4. All hits were found to be dissimilar to known TbrPDEB1 inhibitors. The closest published TbrPDEB1 inhibitor as identified through ROCS or ECFP4 is shown in brackets.