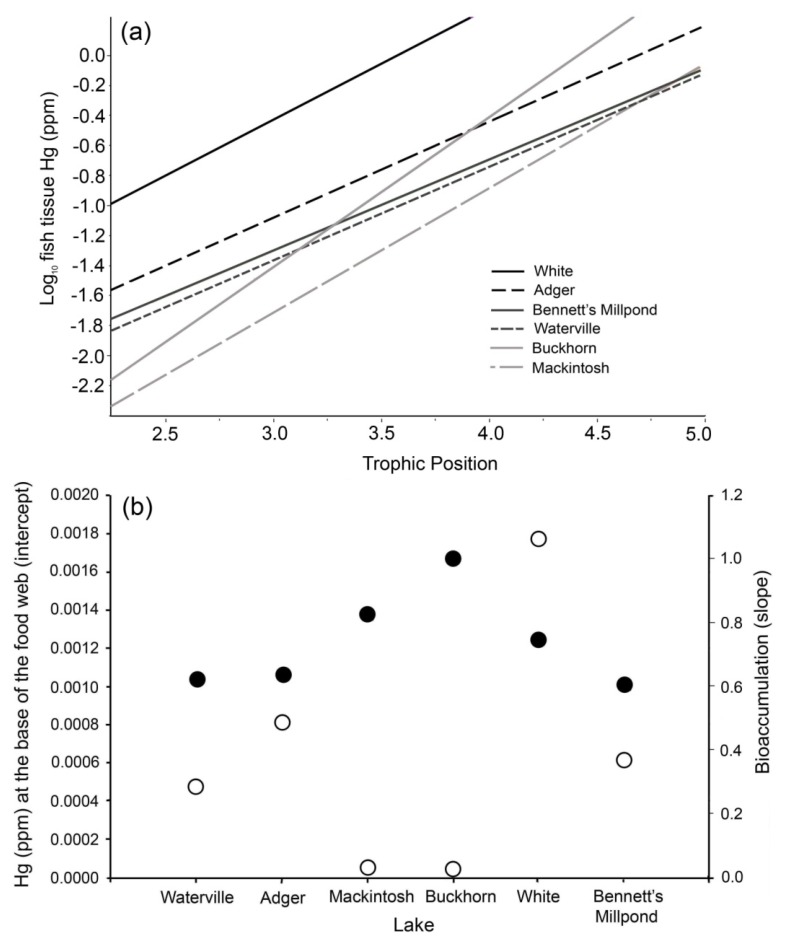
Figure 3.
(a) Regression relationships for fish tissue Hg and trophic level (as measured by nitrogen isotopes) in each of six study lakes in North Carolina, USA, using largemouth bass and bluegill data. (b) Level of mercury at the base of the food web (y-intercept; open circles) and rate of bioaccumulation (slope; dark circles) in each study lake [20,49], determined using the regressions in (a).

