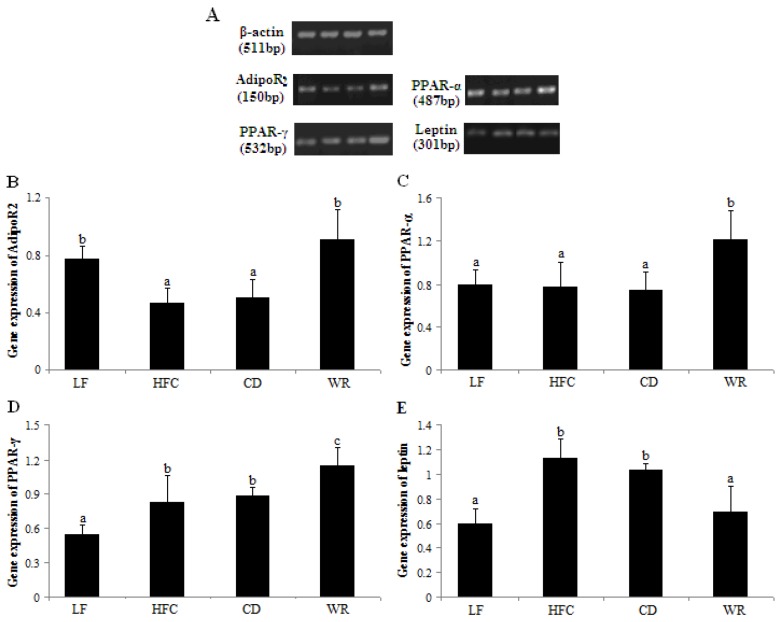
Figure 2.
Relative mRNA abundance of AdipoR2 (A), PPAR-α (B) and PPAR-γ (C) in liver tissues and leptin (D) in epididymal tissues of rats fed with different experimental diets. The steady-state mRNA levels of AdipoR2, PPAR-α, PPAR-γ and leptin were quantified with RT-PCR and normalized against β-actin. Values are expressed as the mean ± SD for five rats. Bars without a common superscript letter indicate significant differences among groups at p < 0.05. LF: low-fat diet; HFC: high-fat/cholesterol diet; CD: city diet; WR: wild rice diet.

