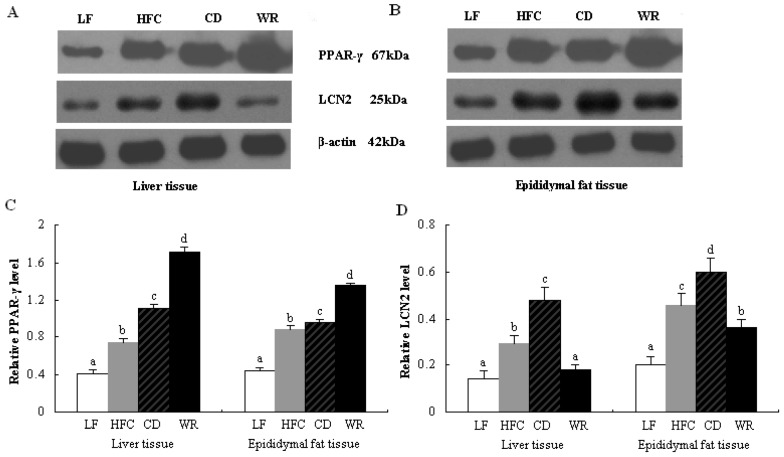
Figure 3.
Protein expression of PPAR-γ and LCN2 in liver and epididymal adipose tissues of rats fed with different experimental diets by Western blot. The intensity of the bands was quantified by densitometric analysis and normalized with corresponding β-actin. Values are expressed as the mean ± SD for five rats. Bars without a common superscript letter indicate significant differences among groups at p < 0.05. LF: low-fat diet; HFC: high-fat/cholesterol diet; CD: city diet; WR: wild rice diet.

