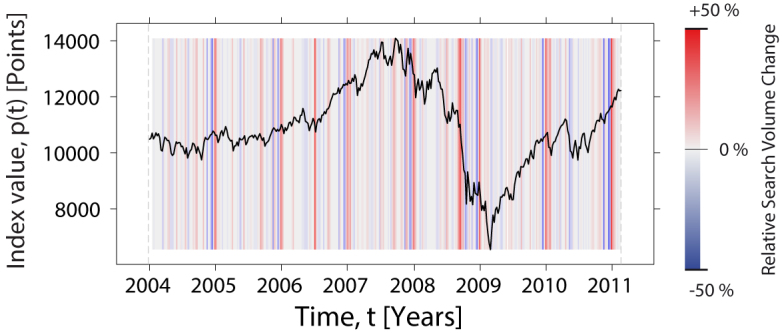
Figure 1. Search volume data and stock market moves.

Time series of closing prices p(t) of the Dow Jones Industrial Average (DJIA) on the first day of trading in each week t covering the period from 5 January 2004 until 22 February 2011. The color code corresponds to the relative search volume changes for the search term debt, with Δt = 3 weeks. Search volume data are restricted to requests of users localized in the United States of America.
