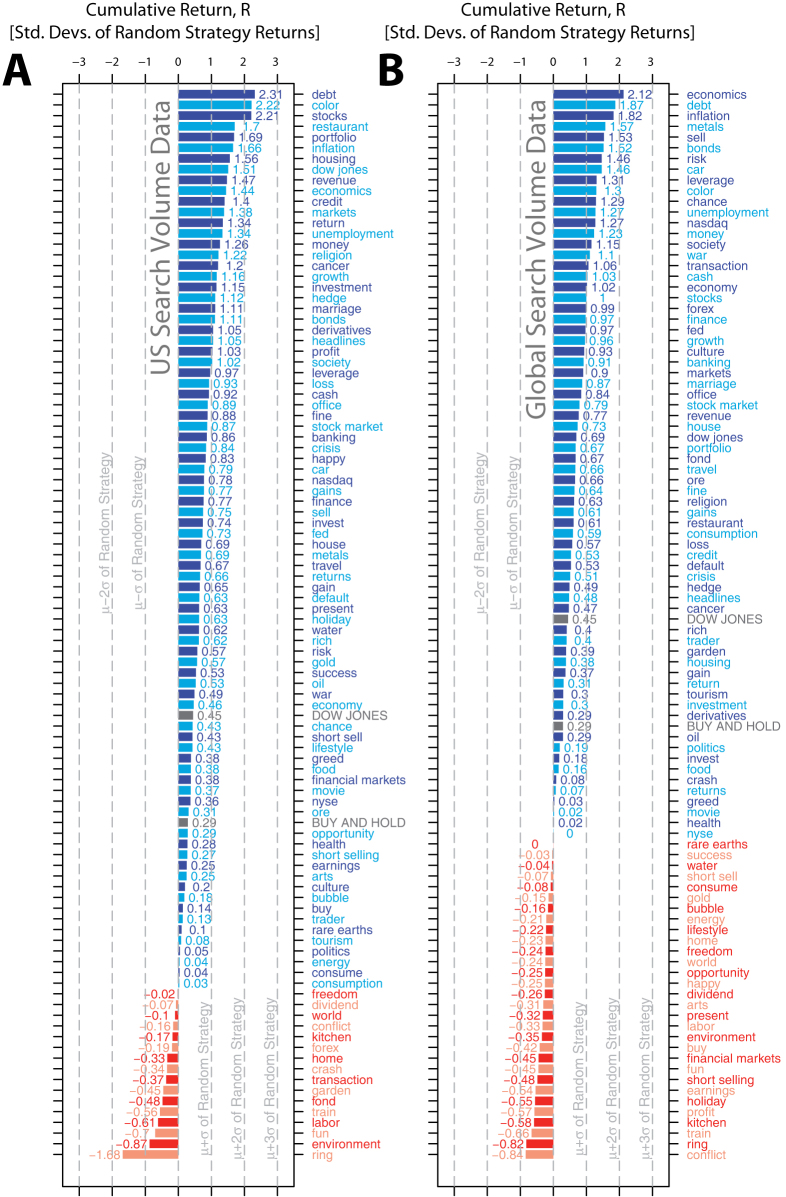
Figure 3. Performances of investment strategies based on search volume data.
(A) Cumulative returns of 98 investment strategies based on search volumes restricted to search requests of users located in the United States for different search terms, displayed for the entire time period of our study from 5 January 2004 until 22 February 2011—the time period for which Google Trends provides data. We use two shades of blue for positive returns and two shades of red for negative returns to improve the readability of the search terms. The cumulative performance for the “buy and hold strategy” is also shown, as is a “Dow Jones strategy”, which uses weekly closing prices of the Dow Jones Industrial Average (DJIA) rather than Google Trends data (see gray bars). Figures provided next to the bars indicate the returns of a strategy, R, in standard deviations from the mean return of uncorrelated random investment strategies, <R>RandomStrategy = 0. Dashed lines correspond to −3, −2, −1, 0, +1, +2, and +3 standard deviations of random strategies. We find that returns from the Google Trends strategies tested are significantly higher overall than returns from the random strategies (<R>US = 0.60; t = 8.65, df = 97, p < 0.001, one sample t-test). (B) A parallel analysis shows that extending the range of the search volume analysis to global users reduces the overall return achieved by Google Trends trading strategies on the U.S. market (<R>US = 0.60, <R>Global = 0.43; t = 2.69, df = 97, p < 0.01, two-sided paired t-test). However, returns are still significantly higher than the mean return of random investment strategies (<R>Global = 0.43; t = 6.40, df = 97, p < 0.001, one sample t-test).

