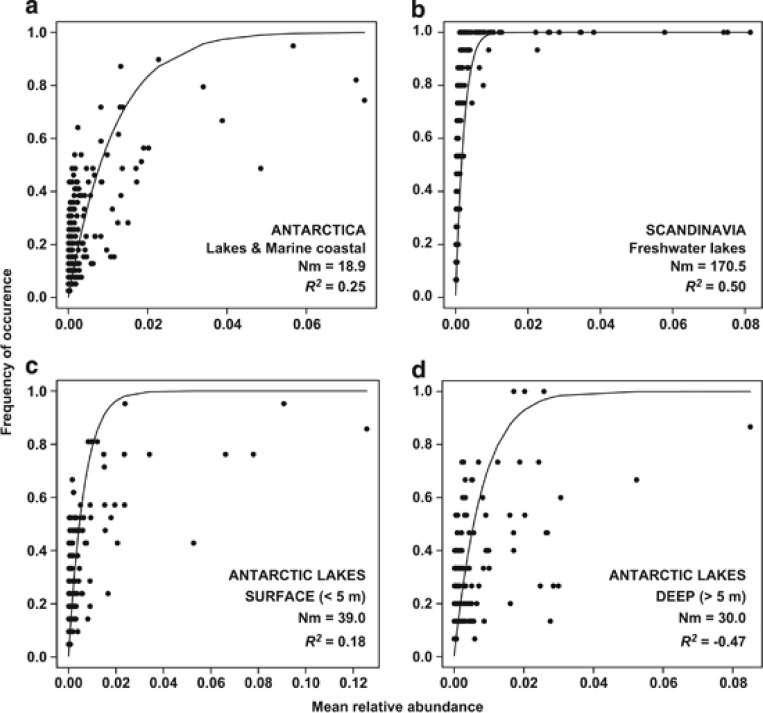
Figure 1.
Frequency of occurrence of different Operational Taxonomic Units as a function of mean relative abundance for Antarctic and Scandinavian communities (2800 reads per sample in all data sets). Lines indicate the best fit to the neutral model as in Sloan et al. (2006). Nm indicates metacommunity size times immigration. R2 indicates the fit to the neutral model, and negative R2 values indicate no fit to this model. The same detection limit d was used in all analyses (d=1/2800). In panel (a), only Antarctic samples were considered, while in (b) only Scandinavian samples were used. Results from surface (<5 m depth) and deep (>5 m depth) Antarctic samples only are shown in panels (c) and (d), respectively.

