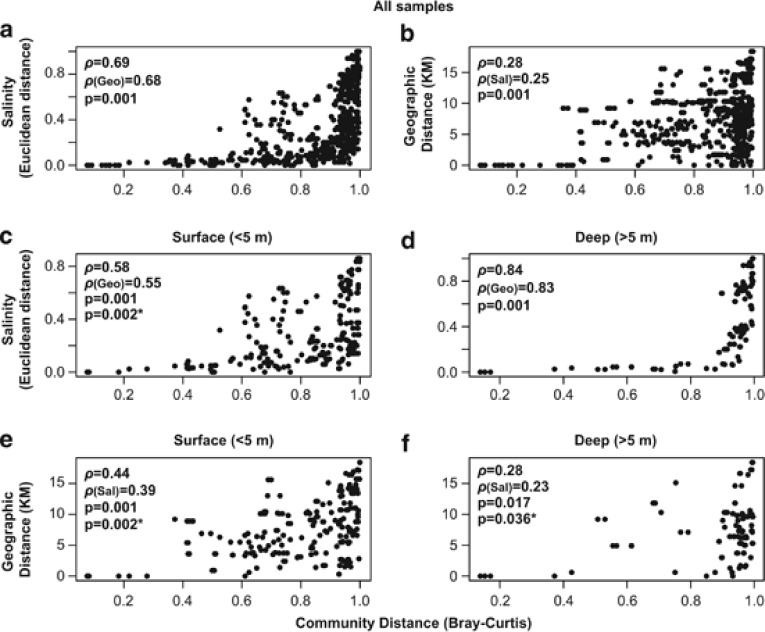
Figure 3.
Correlations between bacterioplankton community composition with salinity and geographical distance between lakes (only Antarctic lakes are considered). In panels (a) and (b), all samples were used, while in panels c–f, samples were divided into surface (<5 m depth) and deep (>5 m depth) categories. Spearman correlation coefficient (ρ) values are shown for regular (first value) and partial Mantel (second) tests. P-values are indicated for each test (*P-values of partial Mantel tests). Only one P-value is shown in cases where both regular and partial Mantel tests presented identical values.

