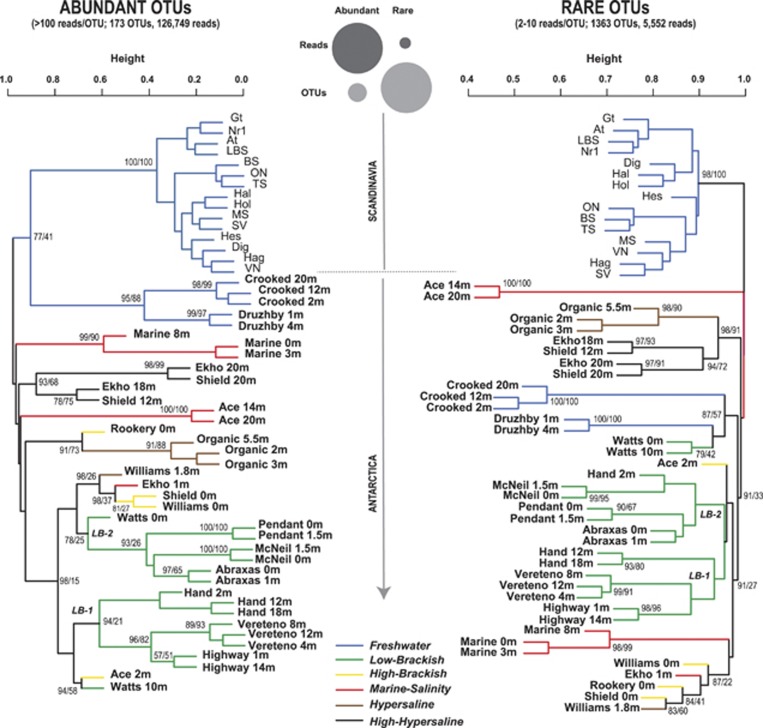
Figure 4.
Contrasted UPGMA clustering of bacterioplankton samples (Bray–Curtis distances) based on their rare and abundant Operational Taxonomic Unit (OTU) composition. Abundant OTUs were arbitrarily defined as those containing more than 100 reads and rare OTUs as those containing between 2–10 reads. There were 173 abundant OTUs, encompassing a total of 126 749 reads. A total of 1363 rare OTUs were present, which included 5552 reads. The circles on the top-center section of the figure illustrate the proportions of OTUs and reads in both the abundant and rare data sets. For the Antarctic data set, the name of the sample and the depth are indicated (using the format: site, depth (in meters)). Most sites refer to lakes, except the ones indicated as ‘Marine'. Support values for the clustering pattern are indicated on top of the branches. Values indicate the approximately unbiased (AU) P-values as well as the bootstrap probability (BP) using the format AU/BP. AU values>95% and BP>70% indicate statistical significance. The colors of the branches indicate the salinity of the samples. LB-1 and LB-2 indicate the two low-brackish clusters.

