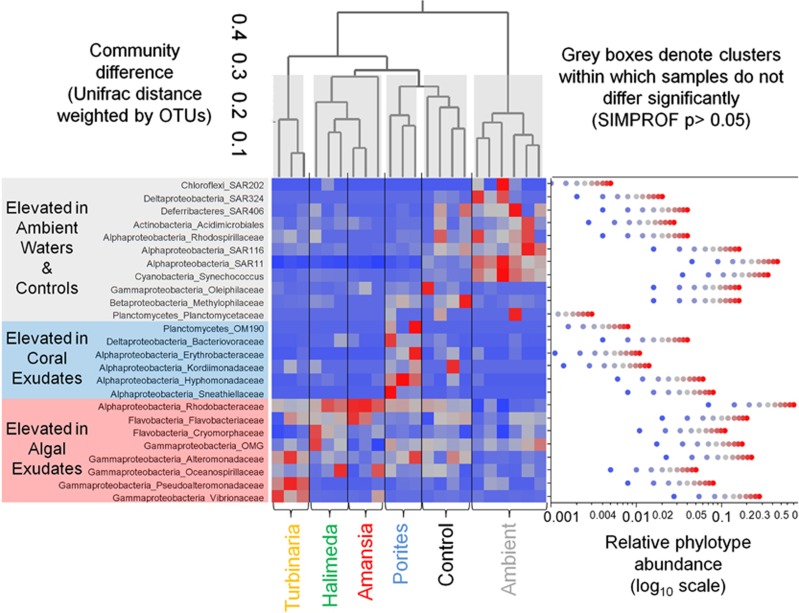
Figure 2.
Heirarchical clustering of samples according to bacterial community similarity, with heatmap showing relative enrichment of family-level clades among samples. At top is an average-neighbor cluster dendrogram built from OTU-weighted Unifrac distances, with gray boxes surrounding samples that cluster and do not differ significantly (SIMPROF P>0.05). Note that communities in replicate incubations within treatments do not differ, whereas treatments differ significantly from each other and from controls and ambient water, except Halimeda and Amansia—amended communities that do not differ significantly. The adjacent heatmap shows relative abundance of each family-level clade in each sample. Heatmap data are standardized by clade to show relative enrichment among treatments; color-coding for relative abundance is shown in the right-hand plot for each clade. Mean relative abundance data and statistical comparisons are provided in Table 4.

