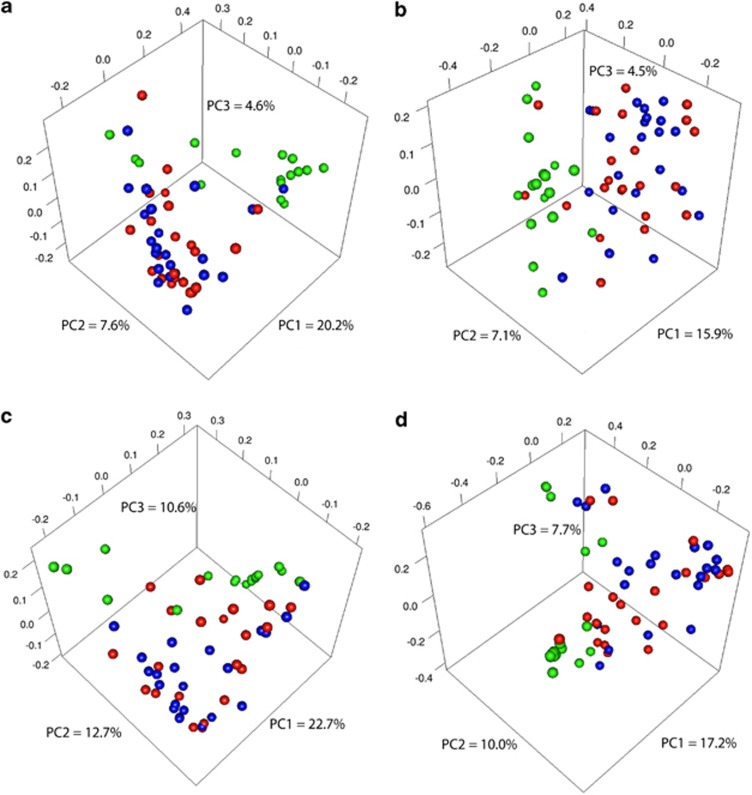
Figure 2.
Communities from periodontitis cluster apart from those in health, while bleeding does not drive community clustering. Graphs are principal coordinate analysis plots based on community membership metrics [(a) is based on unweighted UNIFRAC and (b) on the Jaccard Index] or community structure metrics [(c) is based on weighted UNIFRAC, while (d) is based on the θYC distance]. Communities from healthy subjects appear in green. For the periodontitis group, communities from sites with BoP appear in red, while communities from sites without BoP appear in blue.

