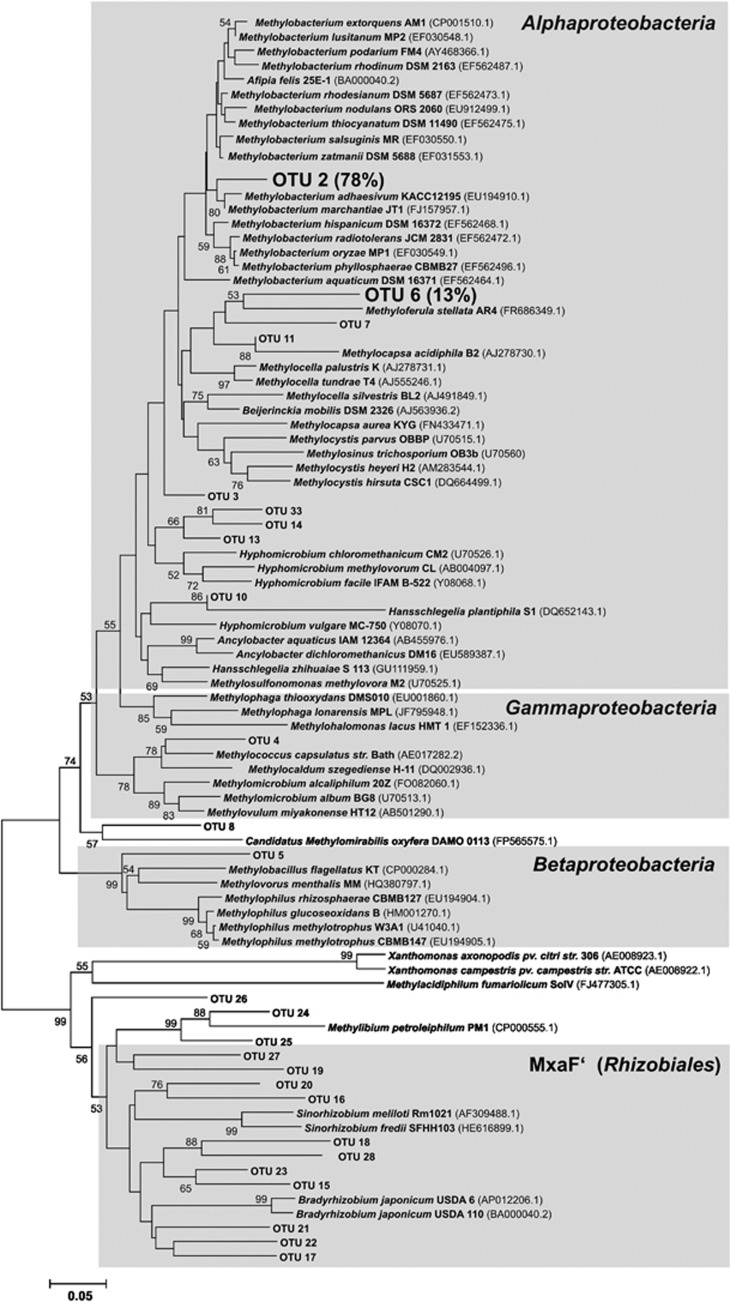
Figure 4.
MxaF protein tree of detected genotypes. Bold genotypes, genotypes with relative abundances >1%, i.e., relative frequencies are given in parentheses. Numbers at nodes, bootstrap values from 1000 replicated trees, those >50% are shown. Scale bar represents an evolutionary distance of 5%. OTU, mxaF genoytpes of rarefied data sets.

