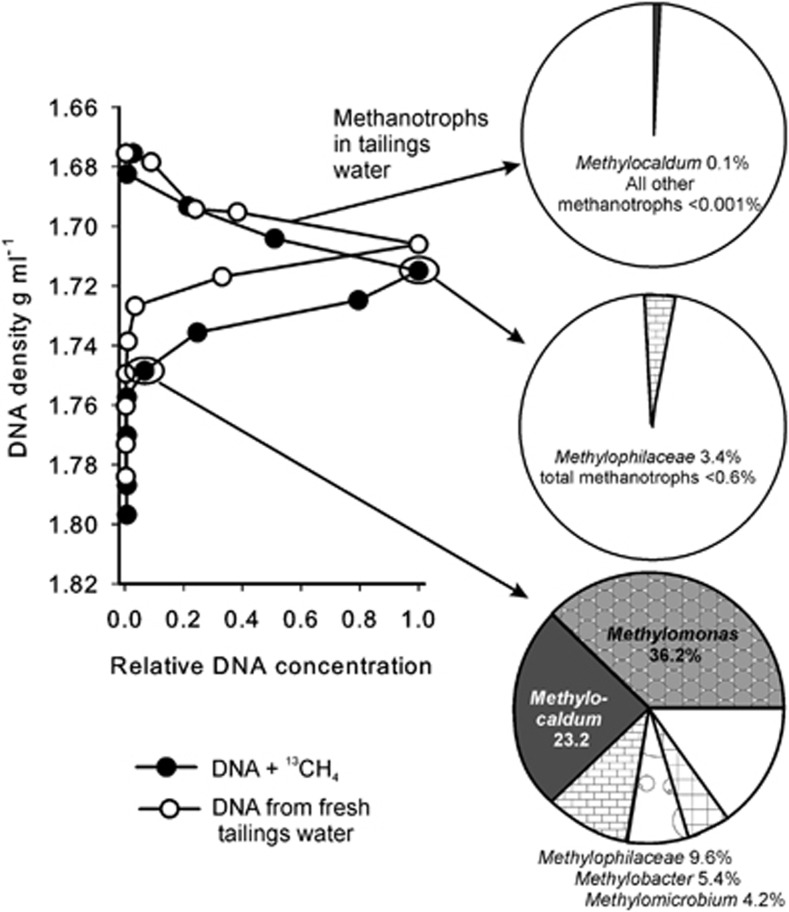
Figure 3.
DNA density gradients and methanotroph communities based on 16S rRNA pyrotag sequencing for a SIP incubation using Pond B surface tailings water. Incubation was under 1% v/v 13CH4 for 10 d. The density profile and methanotrophic community of fresh tailings water is given for comparison. The density profiles were normalized by setting the fraction with the highest concentration to 1. For the SIP, the community from ‘heavy' DNA of 1.75 g ml−1 is compared with that of ‘light' DNA from 1.72 g ml−1. Only methanotrophic groups and abundant methylotrophs in the family Methylophilaceae are shown in the pie charts. White pie sections represent all other bacteria.

