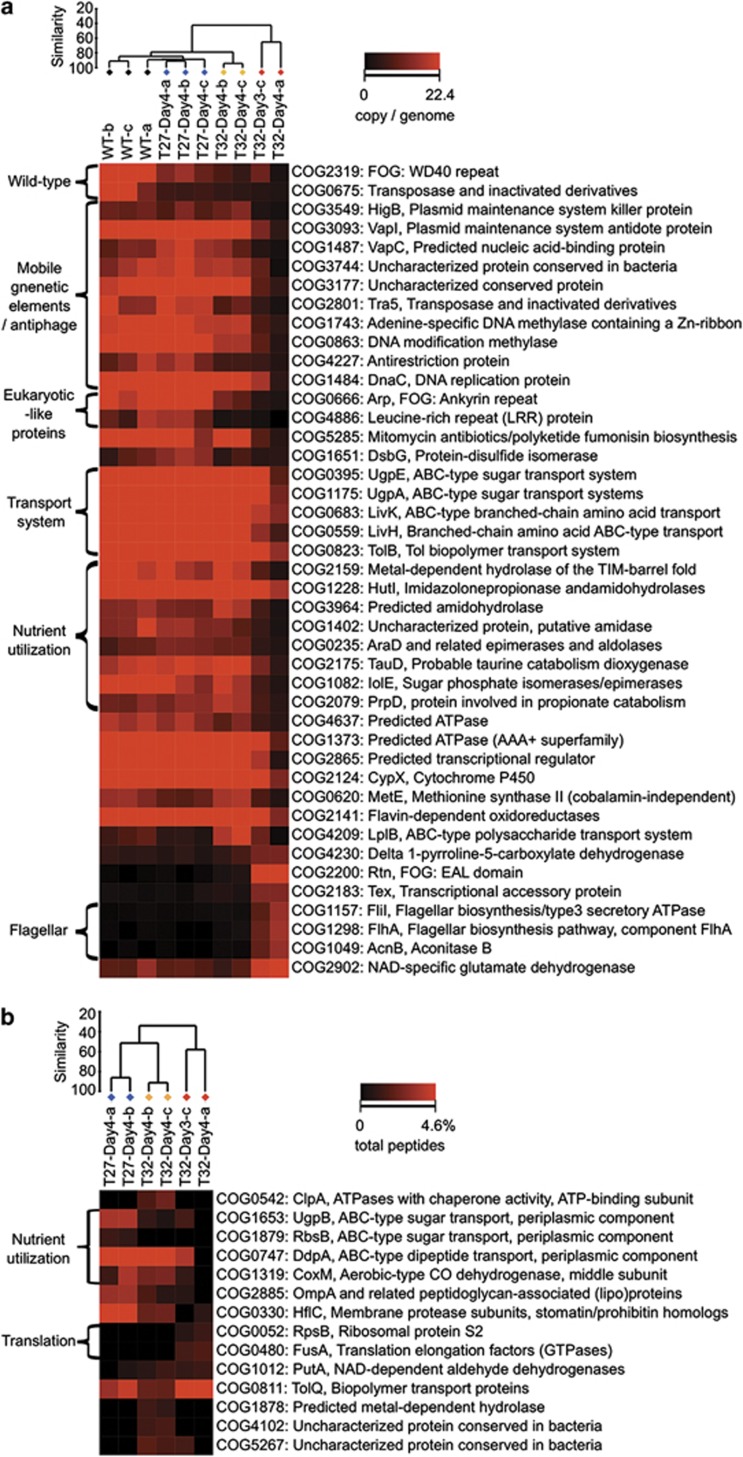
Figure 4.
Abundance of specific functions (annotated by COG) in the metagenomes (a) and metaproteomes (b) of microbial communities in normal and stressed sponge. Samples are clustered using Bray–Curtis similarity and group averages. The heatmap is plotted according to the abundance of each function (copy per genome for metagenome and percentage in all peptides) per sample. Black, the wild-type group. Blue, the healthy group. Orange, the intermediate group. Red, the necrotic group.

