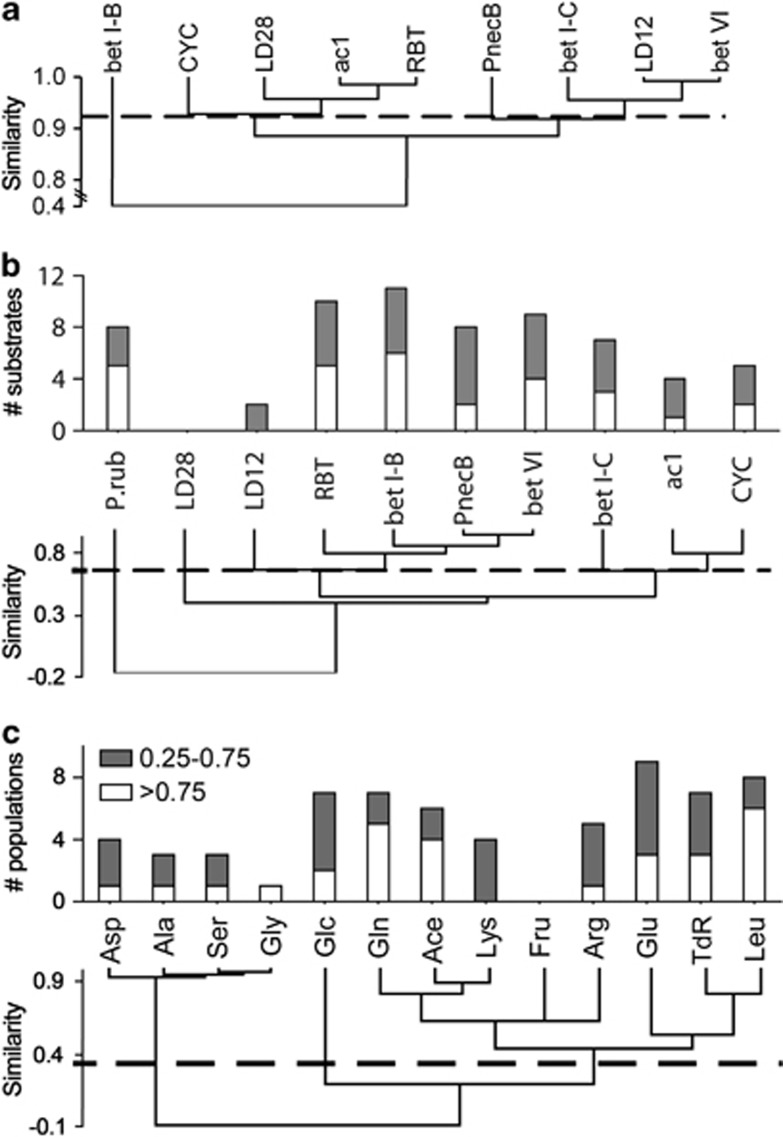
Figure 6.
(a) Agglomerative hierarchical clustering of bacterial populations based on the depth distribution of their abundances in Lake Zurich. (b) Upper panel: Number of substrates incorporated by a specific population to a very high (>0.75, white) or medium (0.25–0.75, gray) extent. Lower panel: Agglomerative hierarchical clustering of bacterial populations based on substrate incorporation. (c) Upper panel: Number of populations incorporating a specific tracer to a very high (>0.75, white) or medium (0.25–0.75, gray) extent. Lower panel: Agglomerative hierarchical clustering of tracers. Agglomerative hierarchical clustering was based on Pearson's correlation coefficients using unweighted pair-group average. Only species- to family-like bacterial populations and all tracers except AA were computed.

