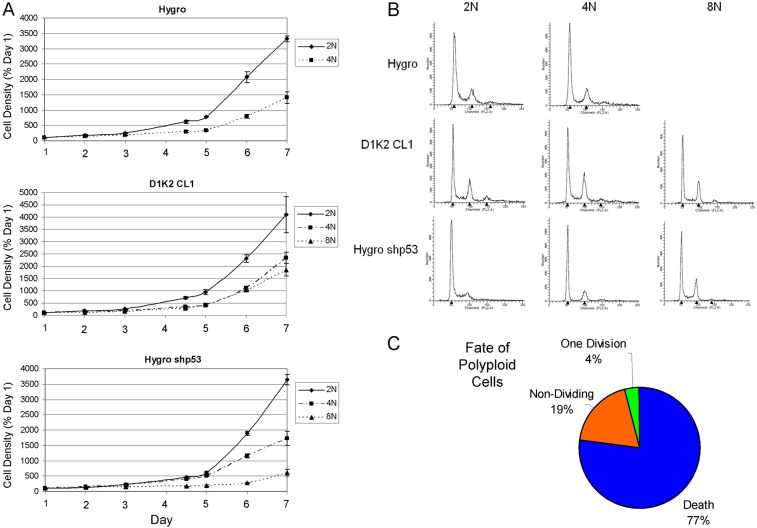
Fig. 6.
Long-term effects of polyploidy on MCF10A cell lines. (A) Growth curves of the indicated cell lines after treatment for 72 hours with 4.5 µg/ml cytochalasin-B and subsequent sorting based on DNA content. Plotted values are Crystal Violet absorbances (±s.d.) normalized to those on day 1. (B) Flow cytometry analysis of the indicated cell lines 1 week after sorting based on ploidy (2N, 4N, 8N). (C) Data obtained through the visual analysis of the fate of tetraploid D1K2 CL1 cells induced with cytochalasin-B for 72 hours.

