Figure 5.
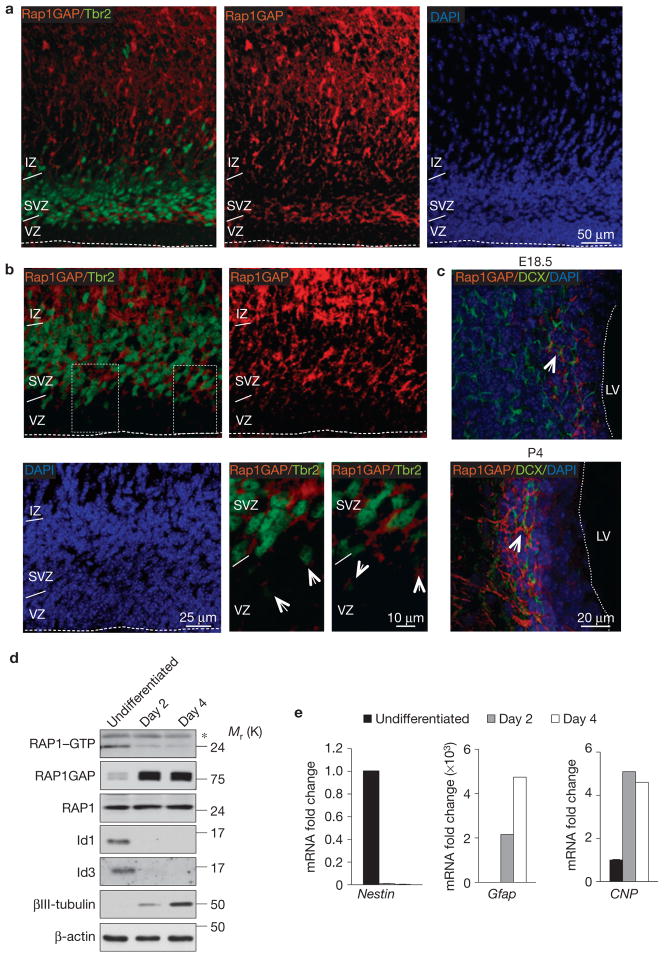
Expression of Rap1GAP in the normal cerebral cortex and NSC differentiation. (a) Immunofluorescence staining for Rap1GAP (red) and Tbr2 (green) in the telencephalon of E18.5 mouse brain. (b) Higher-magnification image of the VZ/SVZ showing that Rap1GAP (red) and Tbr2 (green) are co-expressed by progenitors in the SVZ in the telencephalon. Arrows in the lower right panels (higher-magnification images of the outlined areas in upper left panel) point to the cells in the outer VZ that exhibit weak co-expression of Tbr2 and Rap1GAP. (c) Immunofluorescence staining for Rap1GAP and DCX in the telencephalon of E18.5 and P4 mouse brain. Arrows indicate clusters of Rap1GAP–DCX double-positive cells. The dashed line marks the ventricular surface. VZ, ventricular zone; SVZ, subventricular zone; IZ, intermediate zone; LV, left ventricle. (d) Analysis of RAP1 activity in undifferentiated NSCs or NSCs cultured in differentiation medium for the indicated times using the RAP1 pulldown assay. Protein samples were analysed by SDS–PAGE and western blotting using RAP1 antibody (RAP1–GTP). Total cell lysates were analysed by SDS–PAGE and western blotting using the indicated antibodies. β-actin is shown as a loading control. The asterisk denotes a nonspecific band. (e) Gene expression analysis by qRT-PCR for Nestin, Gfap and CNP in NSCs treated as in d. Data are the means; n = 6 from two independent experiments, each performed in triplicate. Gene expression is normalized to the expression of 18S ribosomal RNA. Uncropped images of blots are shown in Supplementary Fig. S6.

