
Fig. 2.
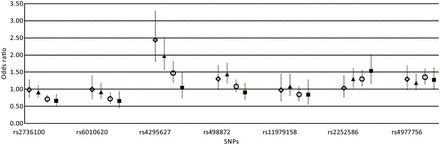
Glioma risk, stratified by specific tumor class, is represented (OR and 95% CI) for each single SNP. The data correspond to the Supplementary material, Table S6. ◊ IDH mutation/1p-19q codeletion/EGFR normal status; ▴ IDH mutation/1p-19q normal status/EGFR normal status; ○ IDH wild-type/1p-19q normal status/EGFR normal status; ▪ IDH wild-type/1p-19q normal status/EGFR amplification.