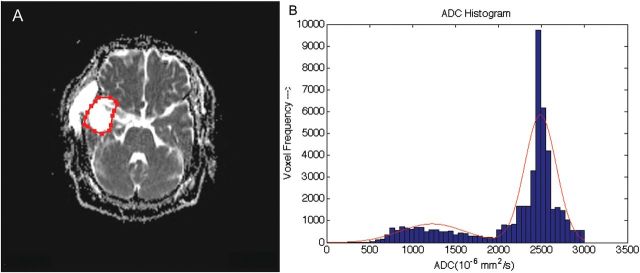
Fig. 2.
The usefulness of ADC histogram analysis in differentiating among pure tumor recurrence, pure treatment necrosis, and mixture of 2 etiology types. (A) ADC map with labeled region of interest (ROI) outlining the lesion extent determined using structural images. (B) ADC histogram with a 2-component normal mixture model fitted to the data (shown in red curve). The patient underwent surgical resection of right temporal lobe glioblastoma, followed by combined temozolomide/radiation therapy. High ADC values in the temporal lobe and low choline with use of MR spectroscopy suggested treatment necrosis; however, the pathological verification confirmed tumor recurrence.

