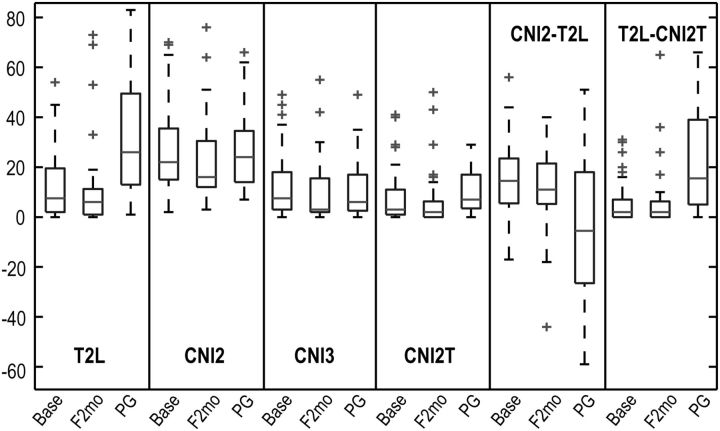
Fig. 3.
Box plots of the numbers of voxels in the T2 lesion within the PRESS volume (T2L), regions that had CNI value >2 (CNI2), regions that had CNI value >3 (CNI3), intersection of the T2L and CNI2 (CNI2T), CNI2-T2L and T2L-CNI2T at baseline, F2mo, and progression (PG). Number of patients are 64, 41, and 36, respectively, at these 3 time points. CNI2-T2L and T2L-CNI2T represent the difference in number of voxels between CNI2 and T2L and between T2L and CNI2T, respectively. Metabolic lesions were larger than the T2L, and the percent of the metabolic lesions within the T2L varied at PG.

