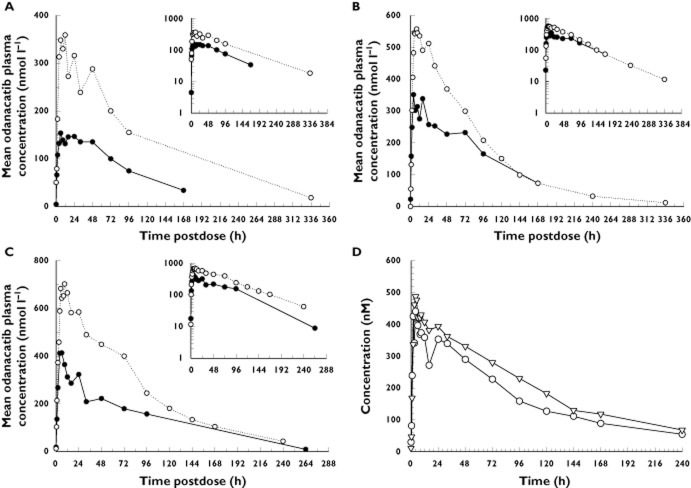
Figure 3.
Arithmetic mean odanacatib plasma concentrations vs. time postdose following single dose administration of 25 mg (A), 100 mg (B) and 200 mg (C) in the fasted and fed (high-fat meal) states to young healthy male subjects (inset, semi-logarithmic scale) and in healthy young males following a single oral dose of 100 mg odanacatib (D) taken with and without a light breakfast. (A)  , 25 mg Fasted;
  , 25 mg Fed; (B)
  , 100 mg Fasted;
  , 100 mg Fed; (C)
  , 200 mg Fasted;
  , 200 mg Fed; (D) ○, Fasted; ▿, Low-fat Breakfast

