Figure 1.

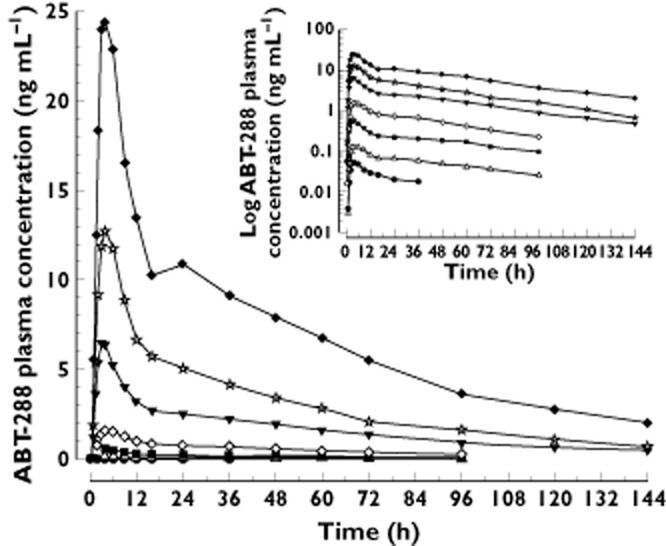
Mean plasma concentrations (linear and log scales) vs. time profiles of ABT-288 after administration of escalating single oral doses to healthy young adults. •, 0.1 mg; ▵; 0.3 mg; ▪, 1 mg; ◊, 3 mg; ▾, 10 mg; ☆, 20 mg; ♦, 40 mg

Mean plasma concentrations (linear and log scales) vs. time profiles of ABT-288 after administration of escalating single oral doses to healthy young adults. •, 0.1 mg; ▵; 0.3 mg; ▪, 1 mg; ◊, 3 mg; ▾, 10 mg; ☆, 20 mg; ♦, 40 mg