Figure 2.

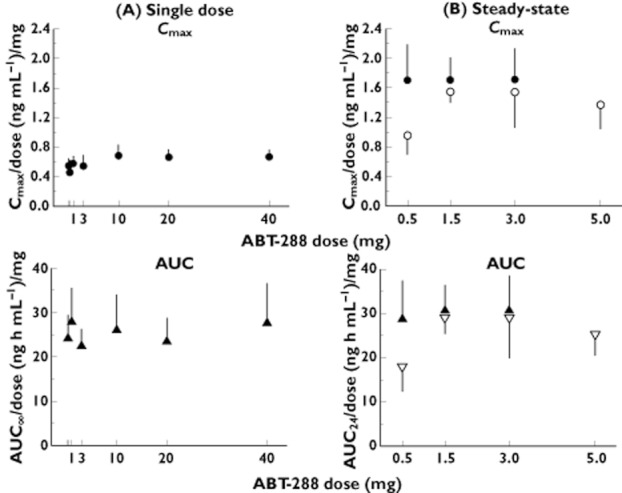
Dose-normalized ABT-288 Cmax and AUC values (mean and SD) vs. dose plots following single dosing (A) or at steady-state (B). Cmax •, young adults; ○, elderly subjects; AUC ▴, young adults; ▿, elderly subjects

Dose-normalized ABT-288 Cmax and AUC values (mean and SD) vs. dose plots following single dosing (A) or at steady-state (B). Cmax •, young adults; ○, elderly subjects; AUC ▴, young adults; ▿, elderly subjects