Figure 1.

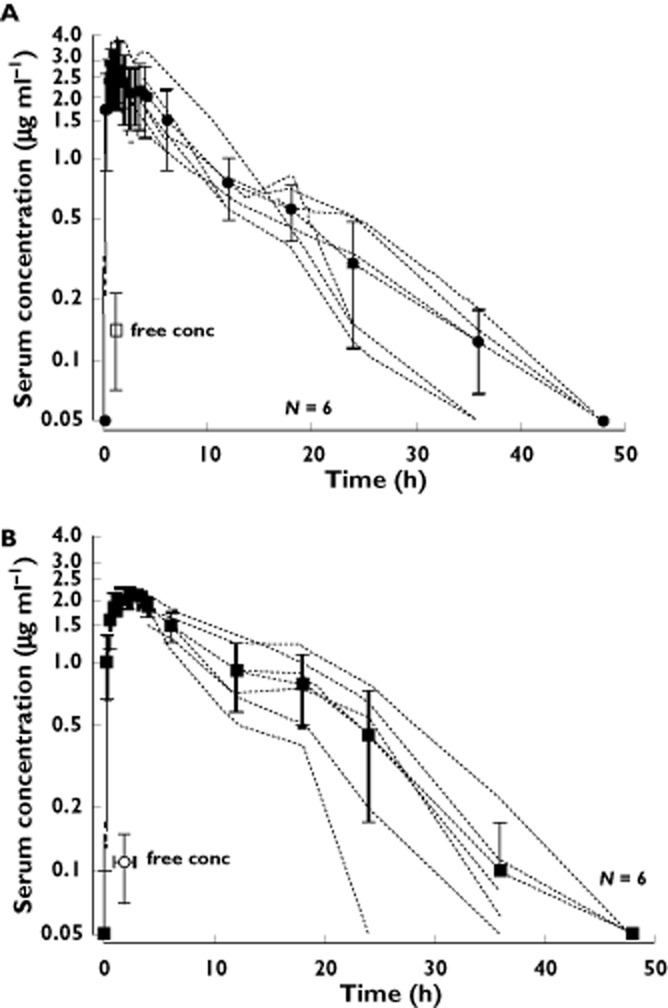
Individual (dotted lines) and mean (solid lines) serum concentration–time curves of ropivacaine 450 mg without (A) and with (B) epinephrine 5 μg ml−1. Mean (SD), free concentration added. LLOQ = 0.050 μg ml−1

Individual (dotted lines) and mean (solid lines) serum concentration–time curves of ropivacaine 450 mg without (A) and with (B) epinephrine 5 μg ml−1. Mean (SD), free concentration added. LLOQ = 0.050 μg ml−1