
Figure 1.
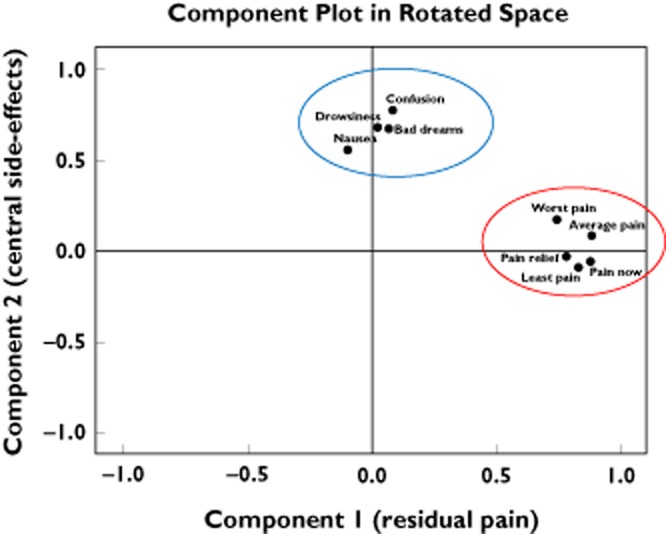
Principal components of morphine response. The co-ordinates of the variables along the axes (components) represent a measure of the strength of the relationship between the variable and the component. Worst pain, average pain, least pain, pain now and pain relief scores correlate highly with component 1 (x-axis); therefore, component 1 appears to represent residual pain on morphine. Confusion, drowsiness, nausea and bad dreams are correlated with component 2 (y-axis); therefore, component 2 appears to represent central side-effects. The variables that are highly correlated with component 1 (residual pain; red ring) have a low correlation with component 2. Likewise, variables that are highly correlated with component 2 (central side-effects; blue ring) have a low correlation with component 1