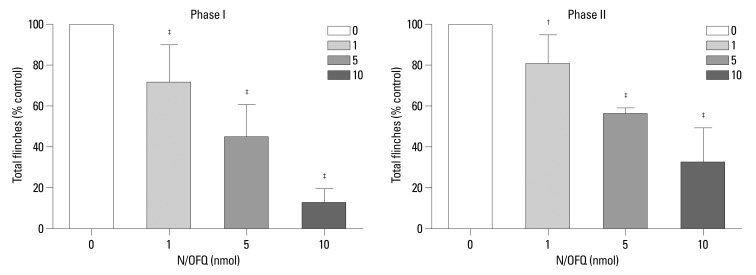
Fig. 2.
The cumulative flinching scores of the rat formalin test after intrathecal administration of nociceptin/orphanin FQ (N/OFQ). X-axis: various doses of N/OFQ (1, 5, 10 nmol in 10 µL) and vehicle (0.9% sterile saline, 10 µL). The drugs and tested vehicle were administered 10 min before formalin injection. Y-axis: percentage of control for total flinches during phase I (1-10 min, top panel) and phase II (11-60 min, right panel) after formalin injection. Each values represents mean±SD (n=8). †p<0.01, ‡p<0.001 versus control. SD, standard deviation.

