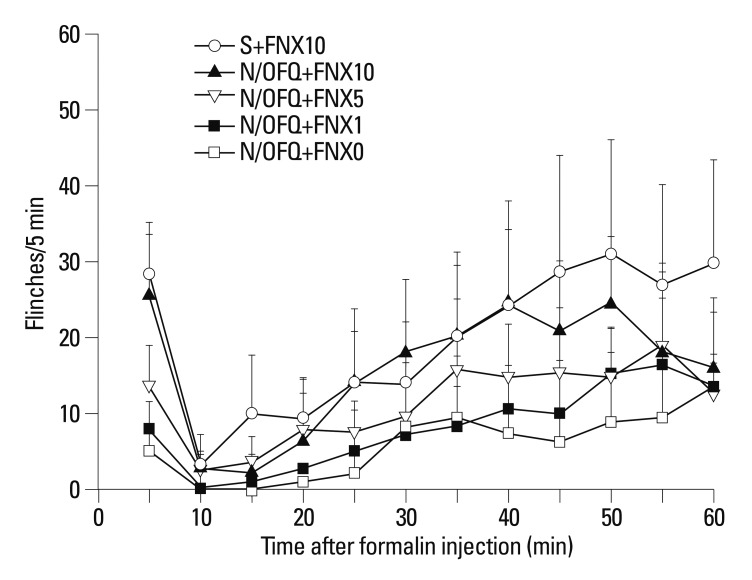
Fig. 6.
Time-effect curves of intrathecal nociceptin/orphanin FQ (N/OFQ) and co-administered β-funaltrexamine (FNX) for flinching responses in the formalin test. X-axis: time (min) after formalin injection. Y-axis: number of flinches for each 5-min session. Each value represents mean±SD (n=8). Symbols represent the different dose conditions for each panel. Ten nmol of N/OFQ was administered intrathecally, followed 5 min later by 1, 5, or 10 nmol of FNX and vehicle (0.9% sterile saline), before the formalin injection. I.t. co-administration of FNX dose-dependently reversed N/OFQ-induced flinching attenuations in the formalin test (p<0.05). SD, standard deviation.

