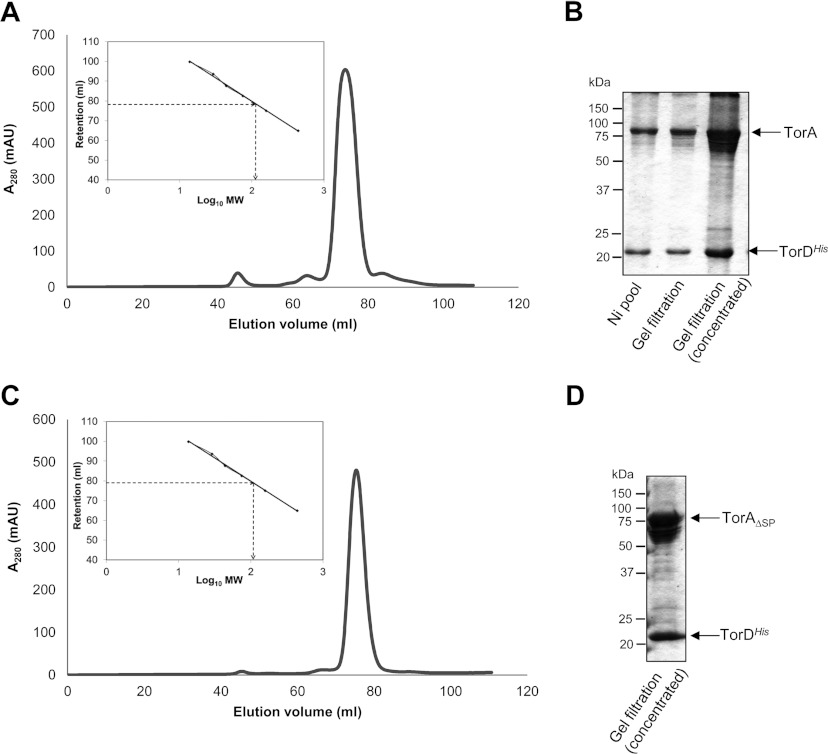
Figure 2. Isolation of a TorA–TorDHis and TorAΔSP–TorDHis complex.
(A and C) TorDHis-containing fractions after metal chelate chromatography of cell extracts overproducing (A) TorA and TorDHis or (C) TorAΔSP and TorDHis were pooled, concentrated and applied to a HiLoad 16/60 Superdex 200 Prep Grade size-exclusion column. Eluted protein was monitored by measuring absorbance at 280 nm. The column was calibrated with the standard proteins ribonuclease (14 kDa), carbonic anhydrase (29 kDa), ovalbumin (44 kDa), conalbumin (75 kDa), aldolase (158 kDa) and ferritin (440 kDa), and the linear regression analysis is shown as inset boxes. R2=0.9976, y=−23.5x+126.83. MW, molecular mass. (B and D) SDS/PAGE analysis (12% gels) of (B) the concentrated fractions after metal chelate chromatography (Ni pool), and the non-concentrated and concentrated peak fractions from SEC of the TorA–TorDHis complex and (D) the concentrated peak fraction from SEC of the TorAΔSP–TorDHis complex. Molecular masses are indicated in kDa.

