
Figure 5.
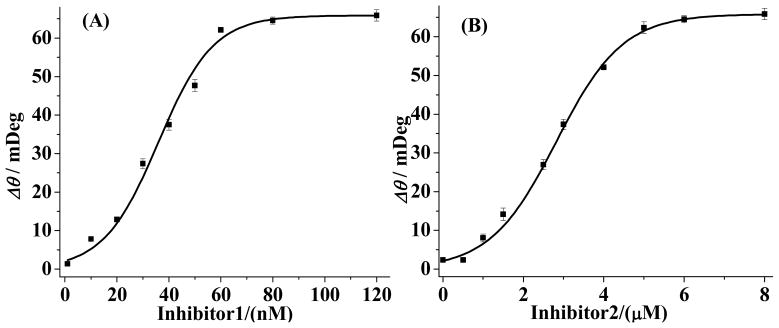
Dependence of SPR signals on concentrations of compound 1 (A) and compound 2 (B). The error bars for each data point are computed from three replicate measurements. Ni-NTA chips were used to obtain the curves.
Official websites use .gov
A
.gov website belongs to an official
government organization in the United States.
Secure .gov websites use HTTPS
A lock (
) or https:// means you've safely
connected to the .gov website. Share sensitive
information only on official, secure websites.
Dependence of SPR signals on concentrations of compound 1 (A) and compound 2 (B). The error bars for each data point are computed from three replicate measurements. Ni-NTA chips were used to obtain the curves.