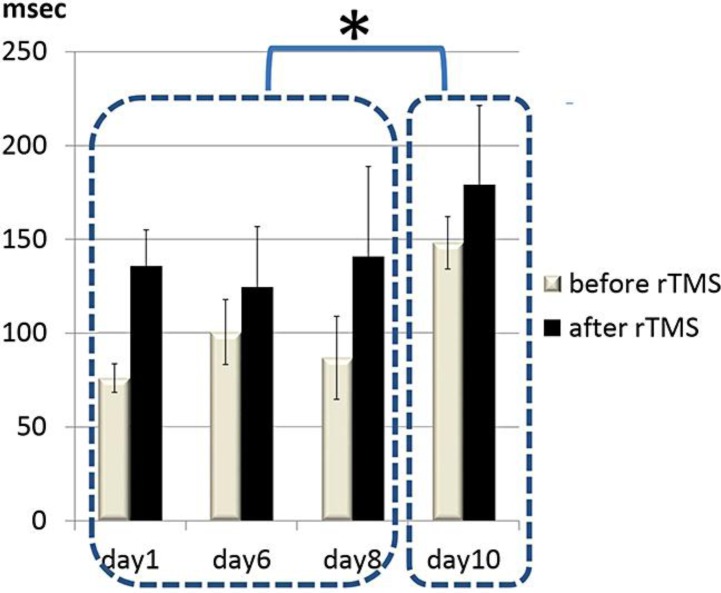
Fig. 2.
Changes in CSPs during rTMS treatment. The CSPs on the right M1 stimulation were examined immediately before and after rTMS during rTMS treatment (days 1, 6, 8 and 10). The mean values ± SD of 5 CSP trials are presented. CSPs were significantly prolonged by rTMS (p < 0.01), and CSPs recorded on day 10 were significantly longer than those recorded on days 1, 6 and 8 (* p < 0.01).

