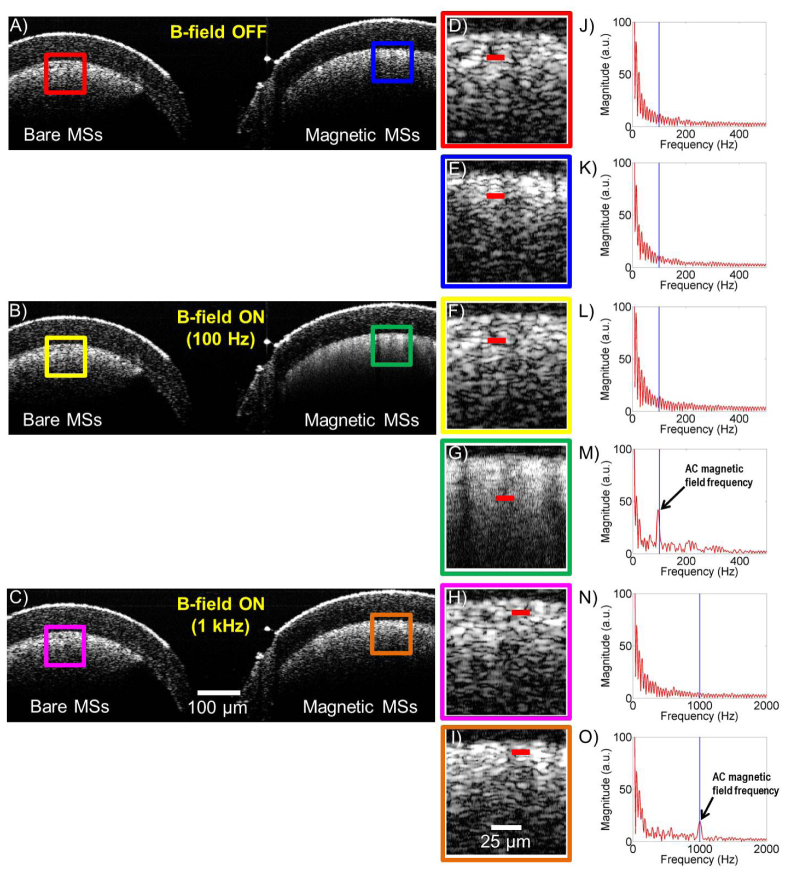
Fig. 3.
Magnetomotive OCT images and signal with a dual-coil configuration: A, B, and C) OCT B-mode images of two plastic tubes (bare microspheres (MSs) as a control (left) and magnetic microspheres (right)). D, E, F, G, H, and I) Magnified regions from the corresponding colored boxes in (A, B, and C). Included videos ( Media 1 (778KB, AVI) and Media 2 (748.6KB, AVI) ) are the OCT images corresponding to (G and I). J, K, L, M, N, and O) Spectral analysis extracted from along the corresponding red lines in (D, E, F, G, H, and I). The spectral analysis results (M and O) revealed the frequency component identical to the external AC magnetic field frequency (100 Hz and 1 kHz), which appeared only when the AC magnetic field was ON.

