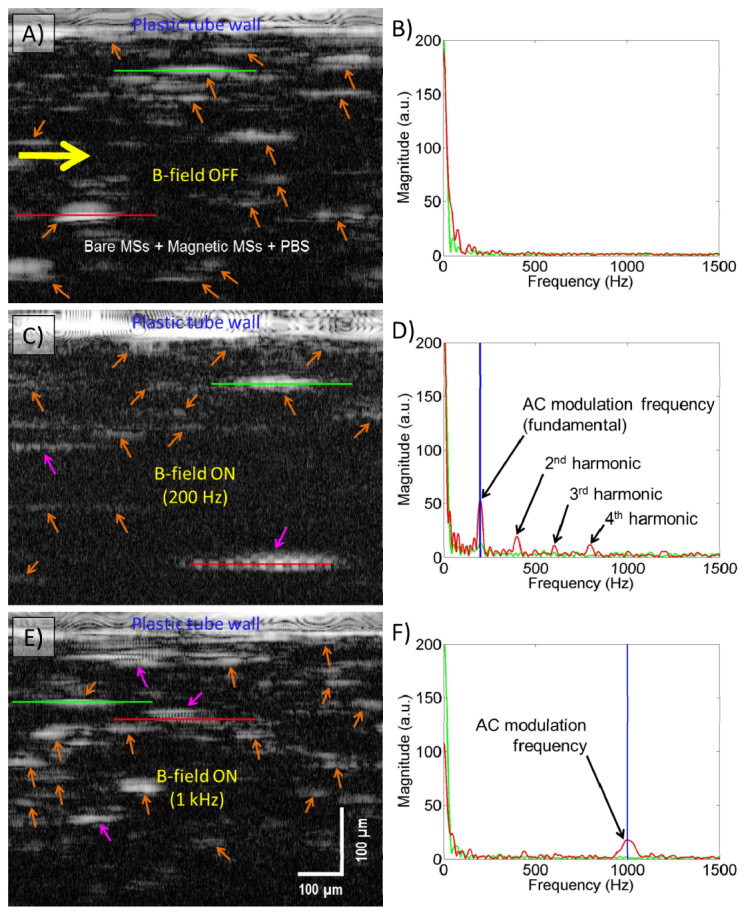
Fig. 5.

Representative MM-OCT images of flowing MSs captured under flow ( Media 4 (3.1MB, AVI) ): A) When the external magnetic field is OFF. B) Power spectrum of two MSs (red and green lines) in (A). C) When the external magnetic field of 200 Hz is ON. D) Power spectrum of two MSs (red and green lines) in (C). E) When the external magnetic field of 1 kHz is ON. F) Power spectrum of two MSs (red and green lines) in (E). The external AC magnetic field frequency (200 Hz and 1 kHz) is clearly visible in the frequency spectrum analysis (D and F; red line). The yellow and orange arrows in (A and B) indicate flow direction and magnetic MSs, respectively. The pink arrows in (C and E) indicate the modulating magnetic MSs.
