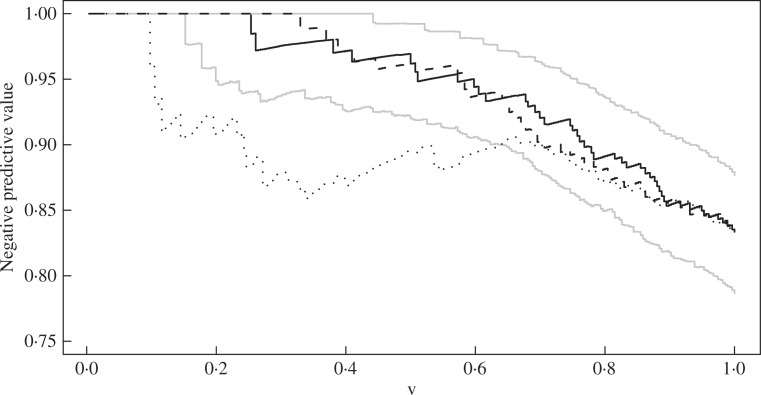
Fig. 1.
Estimation of G(t, υ) at t = 5 years in the breast cancer data. The black solid, dashed and dotted curves pertain to the combination of the gene signature, age and tumor size, gene signature alone, and the combination of age and tumor size, respectively. The grey curves are the 95% pointwise confidence limits corresponding to the black solid curve.

