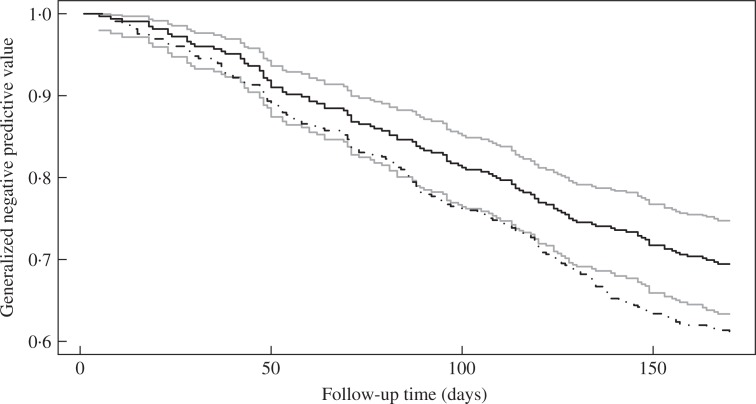
Fig. 3.
Estimates of G(t, υ) at υ = 0.498 in the rhDNase study. The black solid and black dash-dotted curves pertain to the point estimates for the model with forced expiratory volume and treatment and the model with treatment alone, respectively. The grey curves pertain to the 95% pointwise confidence limits associated with the black solid curve.

