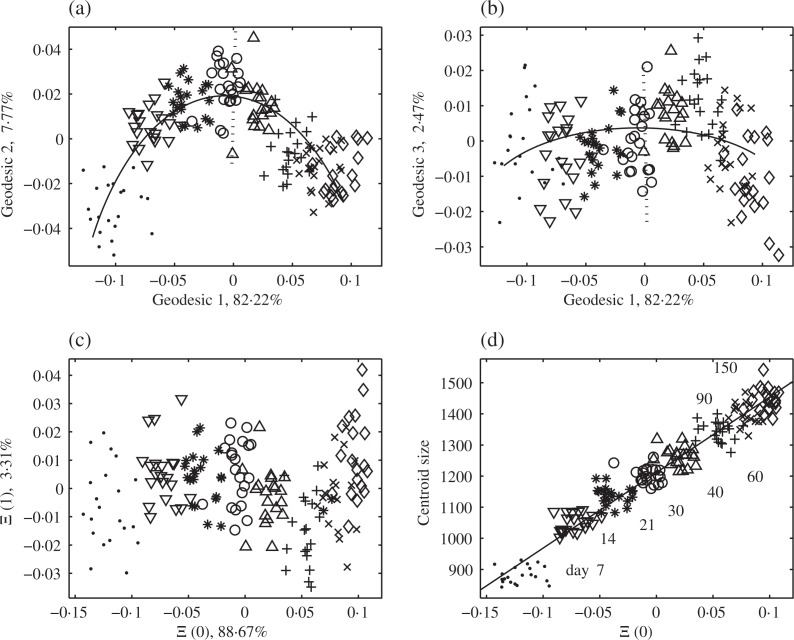
Fig. 5.
Rat skull growth: (a–b) Data plotted by the coordinates by principal nested great spheres; (—) represents the first principal arc, and (· · ·) represents the second principal arc. Different symbols represent different age groups. (c) Data plotted by the coordinates by principal nested spheres. (d) Scatter-plot with centroid size and a regression line.

