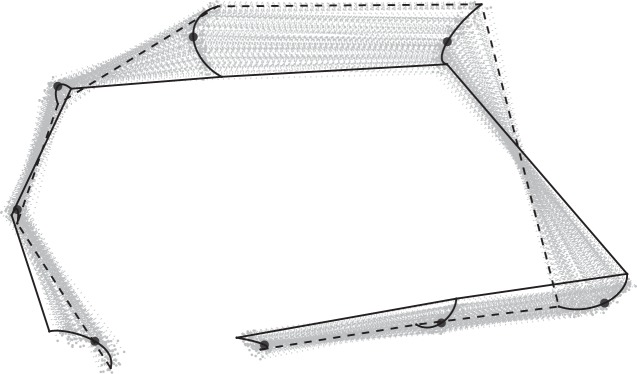
Fig. 6.

Rat skull growth: the first principal mode of variation by 𝔄̂1. The configurations connected by (· · ·) represent the shape of a typical young skull at −2 standard deviations, and (—) represents the shape of a typical old rat skull at +2 standard deviations.
