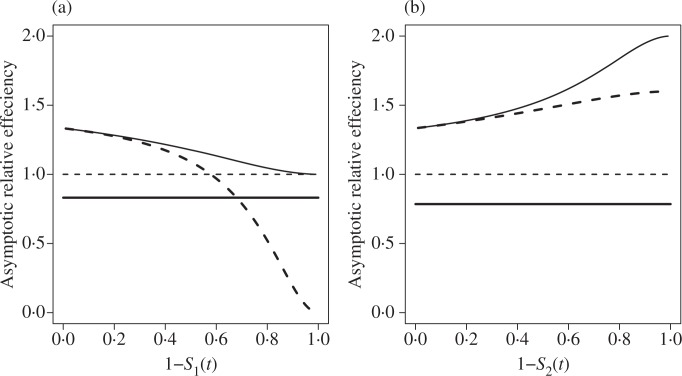
Fig. 2.
Comparison of asymptotic relative efficiencies under the constraint T1 ⩾st T2. The underlying distributions are: S1(t) = S2(t) = exp(−t), (t) = 1 and (t) = exp(−2t). Kaplan–Meier estimator (thin dashed); constrained nonparametric maximum likelihood estimator (thick solid); Rojo’s estimator (thick dashed); pointwise constrained estimator (thin solid).

