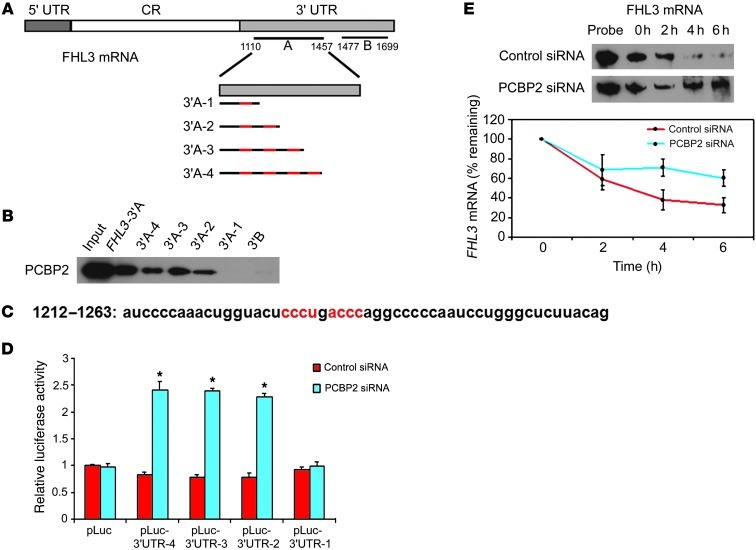
Figure 7. Identification of the FHL3 core recognition sequence; PCBP2 regulates FHL3 expression by stabilizing its mRNA.
(A) Schematic of FHL3 mRNA depicting the 3′ UTR-A in light gray rectangles. The templates for the synthesis of biotin-labeled 3′A-1 to 4 RNAs are indicated by dark lines and CU-rich patches are shown in red. (B) Detection of different binding abilities to PCBP2 by biotin pull-down analysis using the biotin-labeled 3′A-1 to 4 RNA. FHL3 mRNA 3′A and 3′B were included as positive and negative controls. (C) Nucleotide sequence of the identified FHL3 mRNA target binding site, with the core recognition sequence shown in red. (D) T98G cells were transiently transfected with the control siRNA or PCBP2 siRNA and either an empty pLuc reporter plasmid or a pLuc-FHL3 3′A-1,-2,-3,-4 reporter plasmid. *P < 0.001. (E) FHL3 mRNA stability assay in T98G cells transiently transfected with the control siRNA or PCBP2 siRNA. Transfectants were treated with the transcription inhibitor ActD for 0, 2, 4, and 6 hours; the whole-cell RNA was analyzed for FHL3 mRNA levels by an RNase protection assay. Representative blots are shown in the top panel. FHL3 mRNA levels were quantified by densitometric scanning. For each set of siRNA transfections, the band intensity at the 0 hour time point was set to 100%, and the percentage of mRNA remaining at the 2-, 4-, and 6-hour time points is plotted as shown in the bottom panel.

