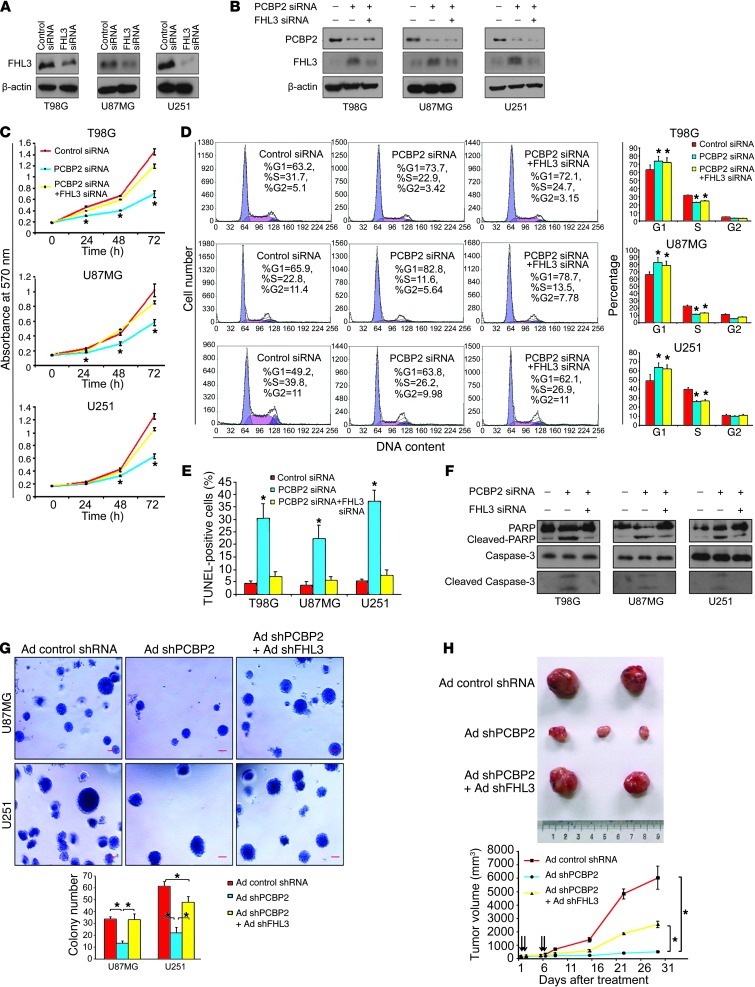
Figure 9. Co-knockdown of PCBP2 and FHL3 rescues the phenotype induced by PCBP2 knockdown alone.
(A) Western blot of FHL3 expression in 3 glioma cell lines transiently transfected with FHL3 siRNA. (B) Western blot showing PCBP2 and FHL3 protein levels in glioma cell lines transiently transfected with the PCBP2 siRNA alone, or PCBP siRNA plus FHL3 siRNA. (C) MTT assay of 3 glioma cell lines after transfection. *P < 0.05 compared with the control transfection and cotransfection by a 2-tailed Student’s t test). (D) The transfected cells above were analyzed by flow cytometry. The proportions of cells in the G1, G2, and S phases are depicted in the histograms. *P < 0.05 compared with the control. (E) Nuclear TUNEL staining for apoptosis in the glioma cell lines. The percentage of TUNEL-positive cells was calculated (n = 5) and plotted on the histogram. *P < 0.05 compared with the control transfection and cotransfection. (F) Western blot showing the levels of (cleaved) caspase-3 and (cleaved) PARP in the transfected glioma cell lines. (G) Anchorage-independent cell growth of U87MG and U251 cells after infection with Ad control shRNA, Ad shPCBP2, or Ad shPCBP2 plus Ad shFHL3 were evaluated by a soft-agar assay. Scale bars: 50 μm. The number of colonies in each field was expressed as the means ± SD (n = 5; *P < 0.05). (H) Subcutaneous tumors isolated from nude mice 4 weeks after adenovirus injection (top). Growth curves of tumors in the nude mice (n = 3 per group) are shown (bottom). Each intratumoral injection of adenovirus is indicated by an arrow.

