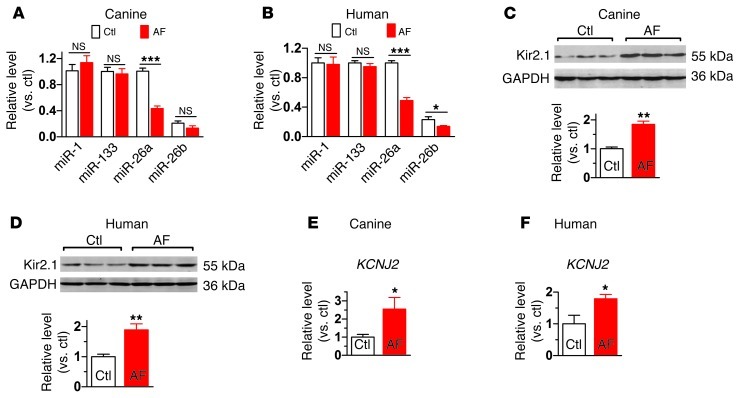
Figure 1. Downregulation of miR-26 and upregulation of KCNJ2/Kir2.1 in AF.
(A and B) qPCR for various miRNAs showing downregulation of miR-26 in atrial samples from a canine model (n = 10 for control [Ctl] and n = 9 for AF) and from AF and sinus rhythm patients (n = 5 per group), respectively. For description of patient population, see Supplemental Table 1. (C and D) Western blot analysis showing significant upregulation of Kir2.1 in atrial tissues from AF dogs (n = 9/group) and AF patients (n = 6 for control and n = 5 for AF). (E and F) qPCR showing significant upregulation of KCNJ2 transcripts in atrial tissues from AF dogs (n = 9/group) and AF patients (n = 6 for control and n = 5 for AF). *P < 0.05, **P < 0.01, ***P < 0.001 vs. control. Values are expressed as mean ± SEM.

