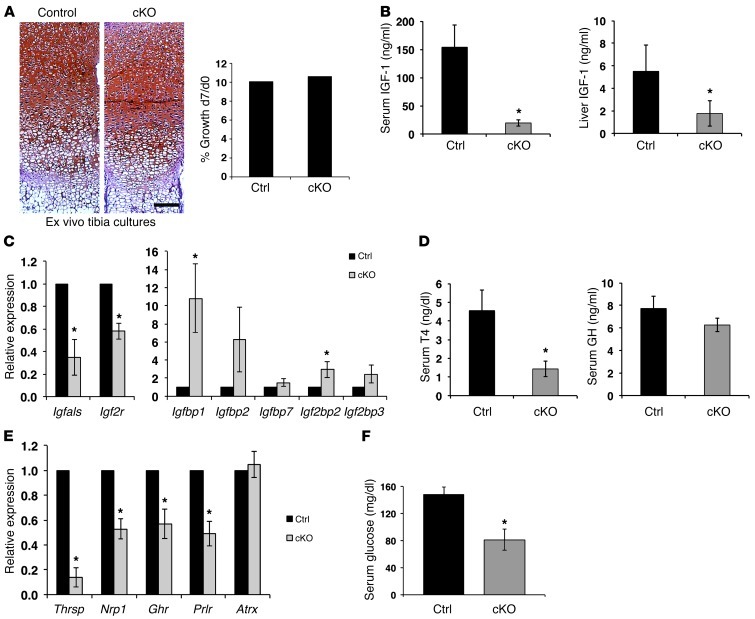
Figure 6. Endocrine defects and hypoglycemia in Atrx-cKO mice.
(A) Longitudinal growth of control and cKO tibia was measured after 7 days (d7) of ex vivo culture. Results are expressed as the ratio of length at d7 to that at d0. No difference in growth was detected between control and cKO mice (n = 3). Scale bar: 100 μm. (B) Serum and liver IGF-1 levels are decreased in cKO mice (n = 3). (C) Expression of several IGF-1 pathway genes is altered in cKO liver compared with controls (n = 3). Real-time data were normalized to Gapdh expression. (D) Circulating T4 levels are significantly decreased in P20 cKO mice compared with controls, while GH levels are only mildly affected (n = 3). (E) Thyroid hormone target genes exhibit decreased expression in the liver of P20 cKO mice compared with controls (n = 3). Real-time data were normalized to Gapdh expression. (F) Glucose levels are reduced in P20 cKO serum compared with controls (n = 5). Original magnification, ×50 (A). *P < 0.05.

